Bitcoin’s loses $78k while the US markets sleeps – risk takes over from oil as crude prices stay flat

Bitcoin fell 2.86% today from yesterday’s intraday high while the S&P 500 gapped lower.
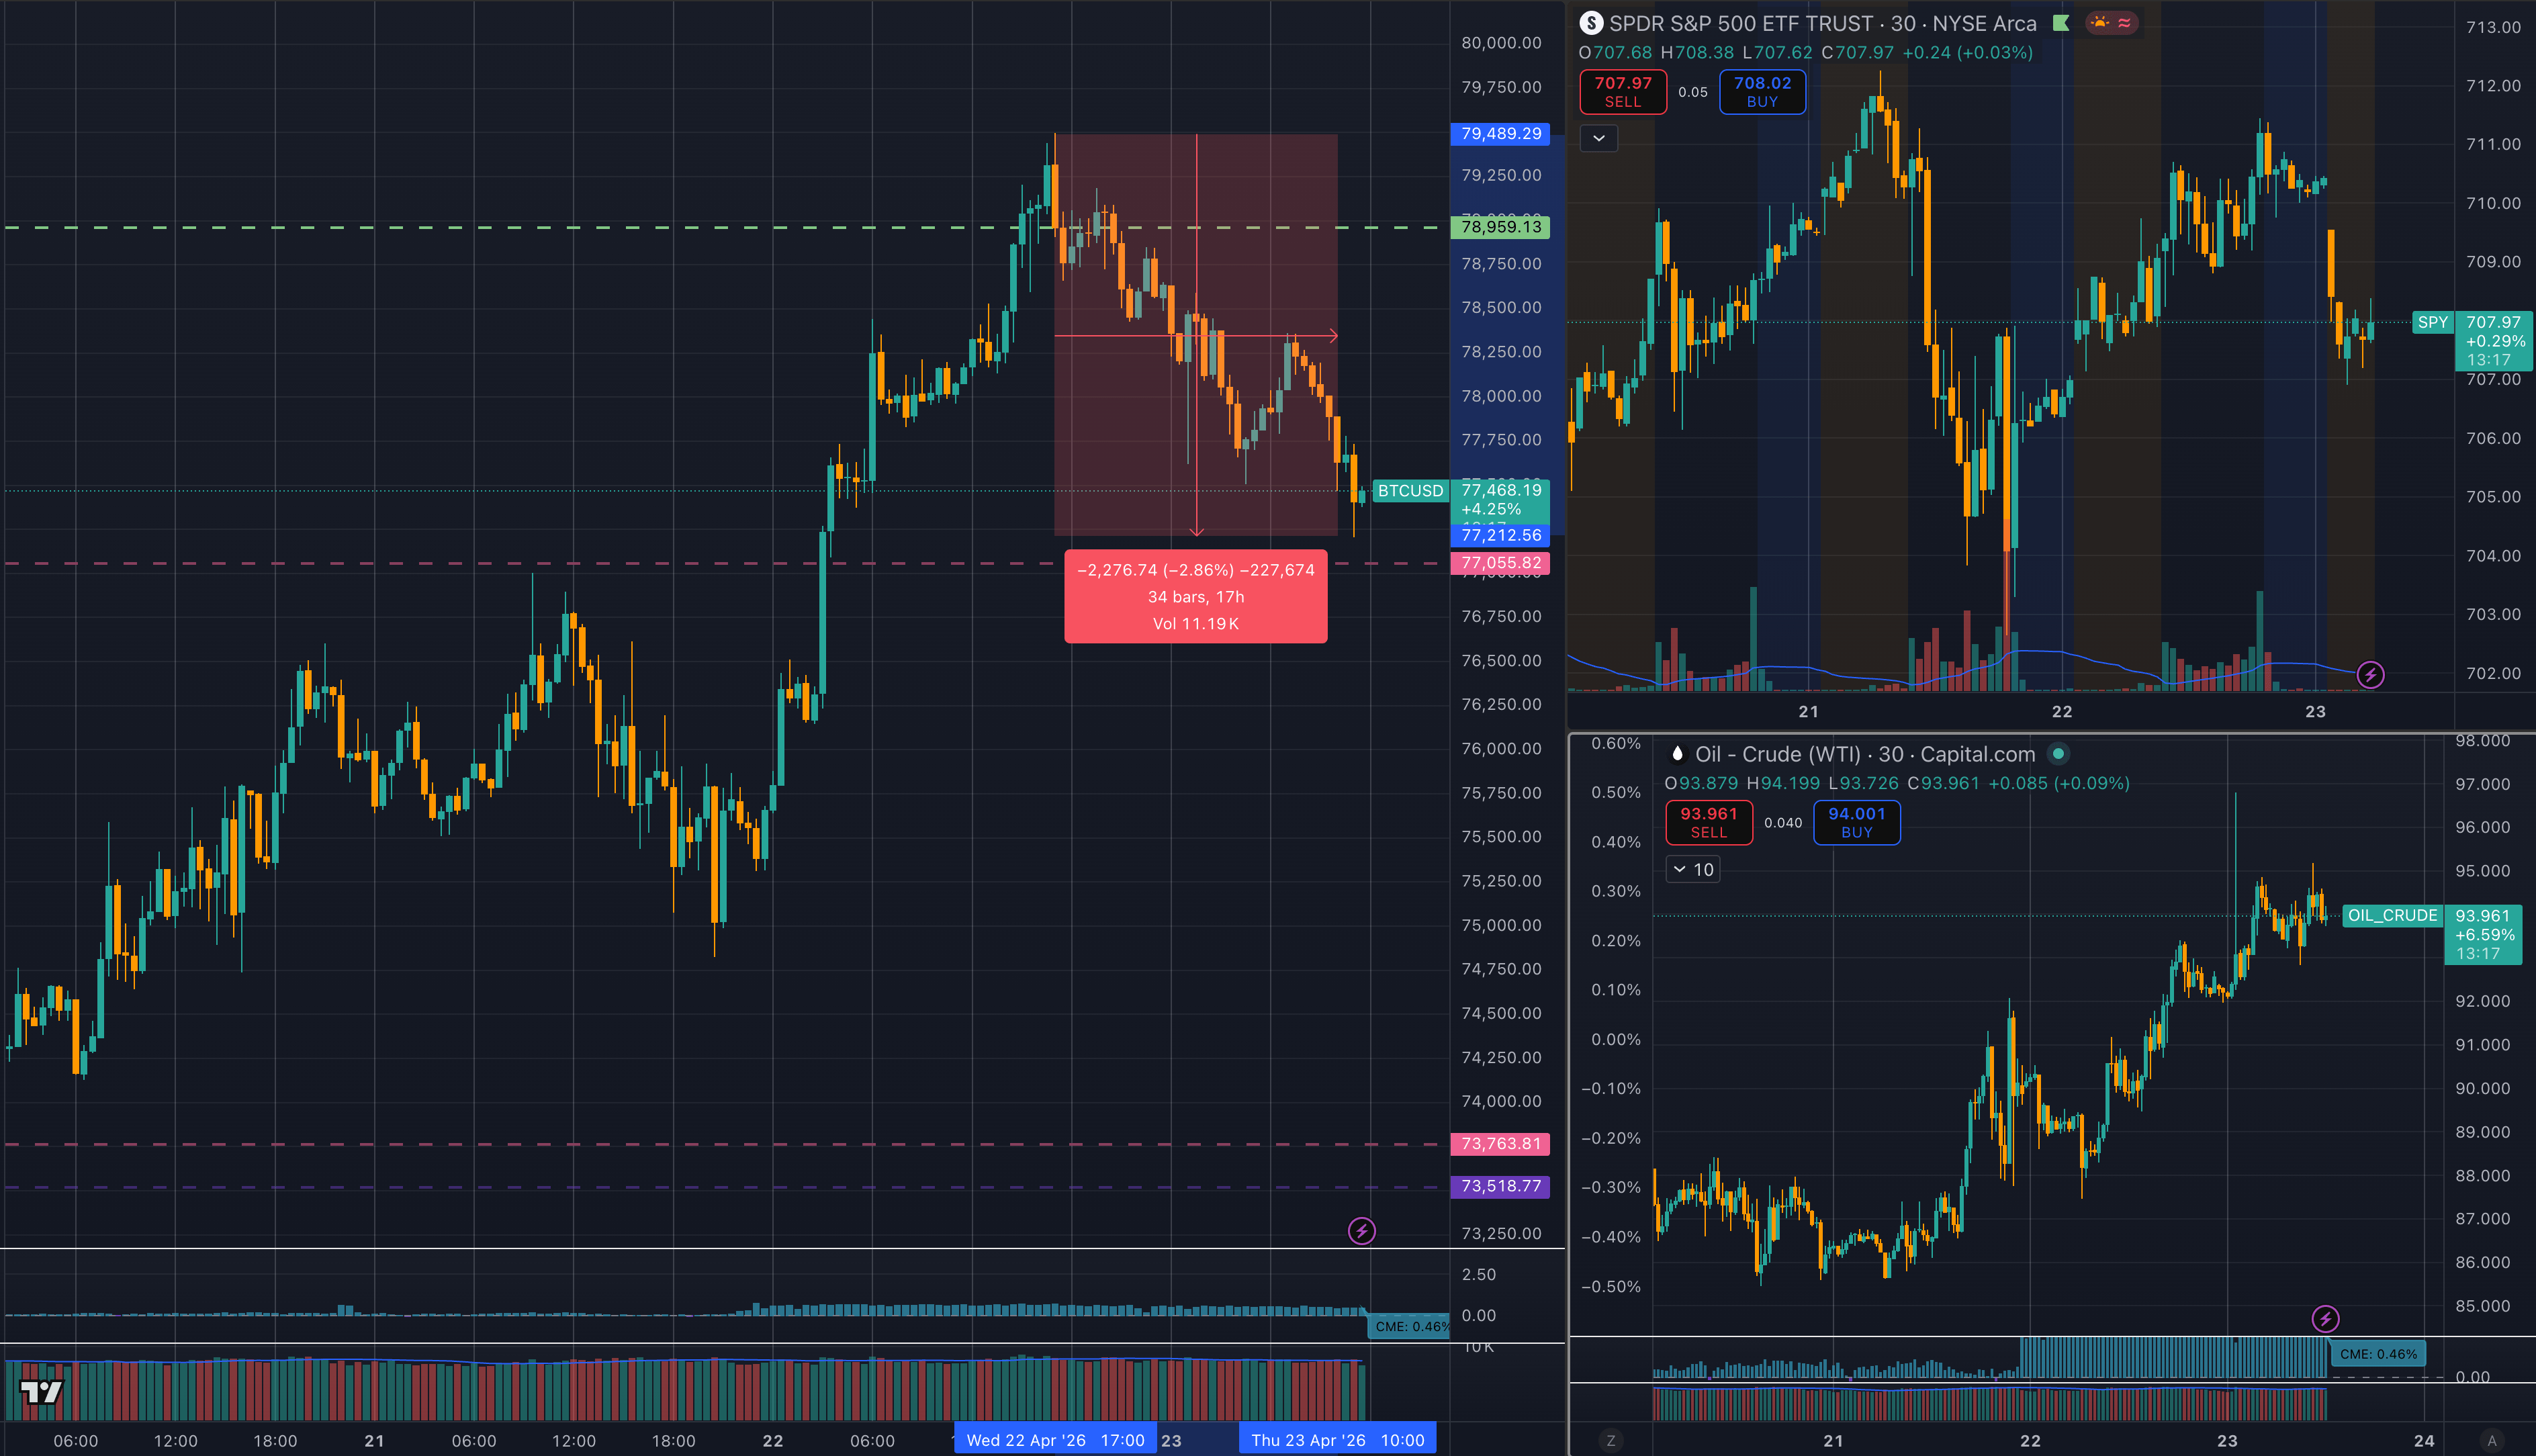
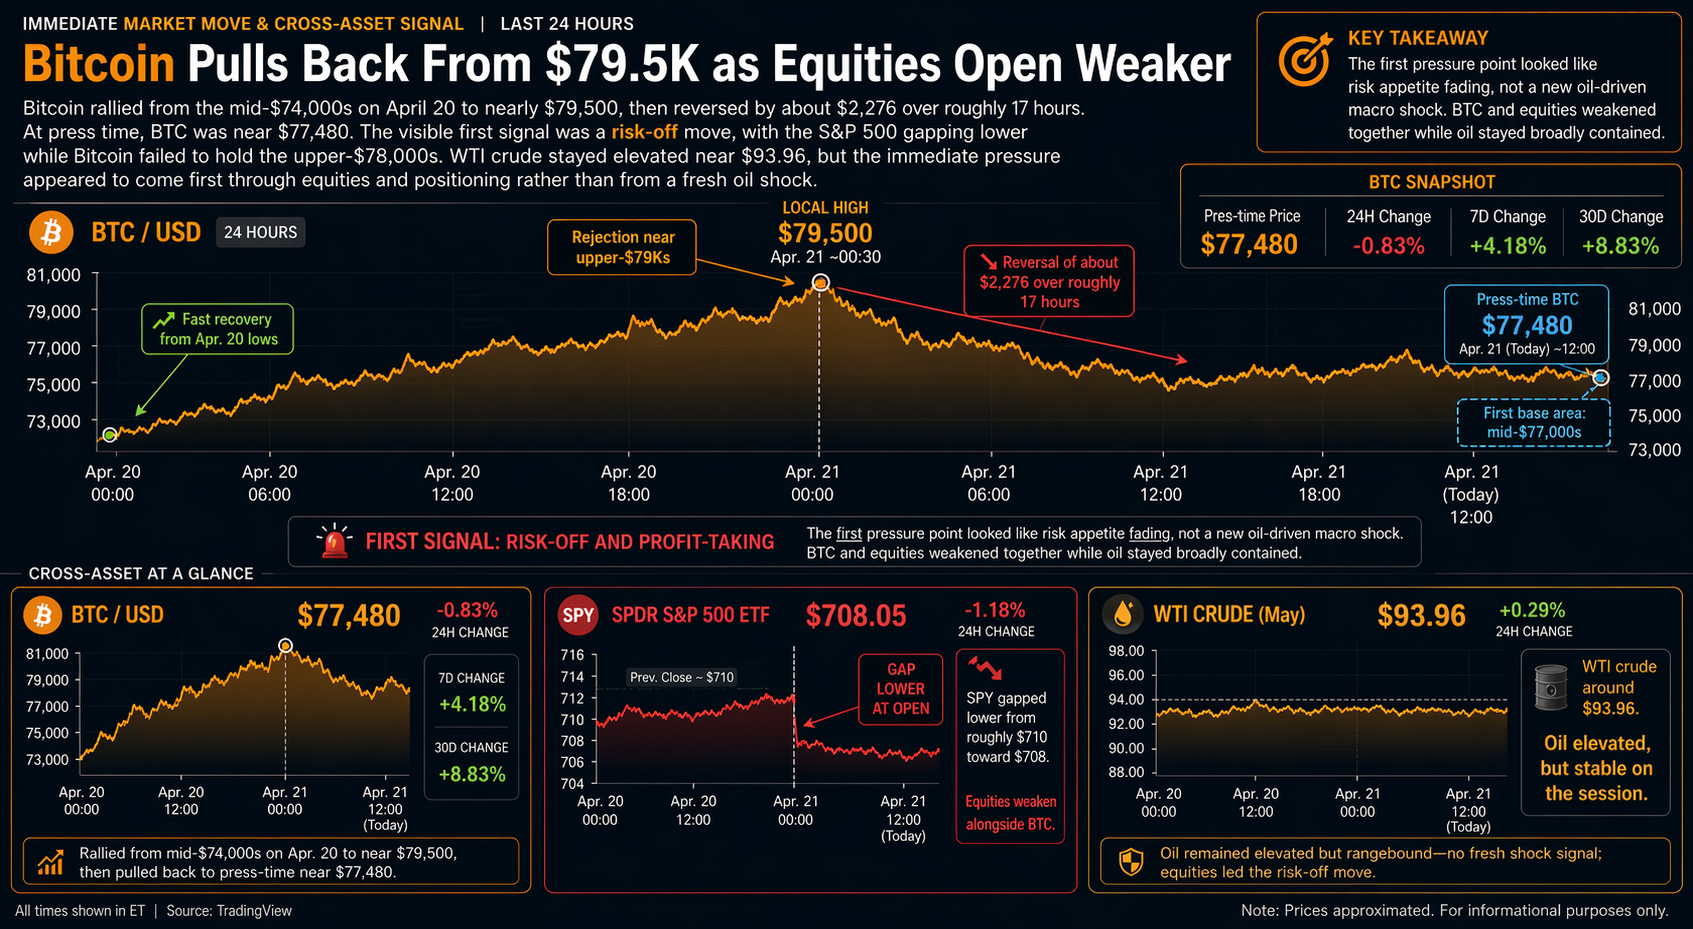
The current Bitcoin price chart shows BTC rallying from roughly the mid-$74,000s on Monday, Apr. 20, to a local high near $79,500 yesterday, then reversing by about $2,276 over roughly 17 hours.
As of press time, Crypto Finderss Bitcoin page shows BTC near $77,480, keeping the market back near the mid-$77,000s.
The cross-asset setup around the drop is interesting. The S&P 500 shows a pre-market and early-session gap lower on the SPY view, from roughly $710 toward $708.
WTI crude sits around $93.96, roughly the same level it showed when BTC hit $79,400. That combination points first to risk appetite and positioning.
Oil remains part of the broader macro frame, while the visible morning impulse begins as equities soften and Bitcoin fails to hold the upper-$78,000s.
That distinction narrows the interpretation. Bitcoin is still exposed to oil through inflation, yields, and Fed expectations.
The latest price action suggests the first pressure point is the risk channel, with the oil and rates channel operating in the background. The question now is whether BTC can turn the mid-$77,000s into a base before the Apr. 24 options expiry and the next macro calendar cluster.

Risk Appetite Sets The First Signal
Crypto Finderss live market data shows BTC down 0.83% over 24 hours, even though the current Bitcoin price chart shows a much larger peak-to-trough move from the recent high.
The difference is useful. It separates the visible intraday rejection near $79,500 from the broader multi-day recovery, where BTC remains up 4.18% over seven days and 8.83% over 30 days.
The broader crypto market data helps place that move in context. Bitcoin still held the largest market share in a market where leadership has been concentrated in the most liquid asset.
That concentration usually appears when capital is selective. It suggests traders are willing to hold Bitcoin exposure, yet they are slower to chase the rest of the risk curve when macro conditions are tense.
The S&P 500 gap adds the market cue. When BTC and equities weaken together while crude stays contained, the cleaner interpretation is a reduction in risk appetite.
Traders cut exposure where gains were fastest, and liquidity is deepest. Bitcoin fits that pattern because it had already squeezed higher into overhead supply near $80,000.
The current Bitcoin price chart makes the rejection visible. BTC had climbed from the mid-$74,000s to the edge of the upper-$79,000s, then lost nearly 3% over 34 half-hour bars.
A market can absorb that after a fast advance. It can also reveal where marginal buyers stop following.
The first answer comes from the mid-$77,000s. Holding there keeps the move inside a normal retrace.
Losing it shifts attention toward the lower realized-price bands that have defined this rebound.
The S&P 500 shows the same pressure from another angle. A gap lower in SPY does not prove a Bitcoin selloff on its own.
This morning, the market appears to be punishing risk rather than rewarding leverage. Put simply, the visible setup begins with equities and BTC moving together, while crude fails to provide a fresh shock that would make energy the dominant tick-by-tick explanation.
Oil, Flows, And Positioning Shape The Ceiling
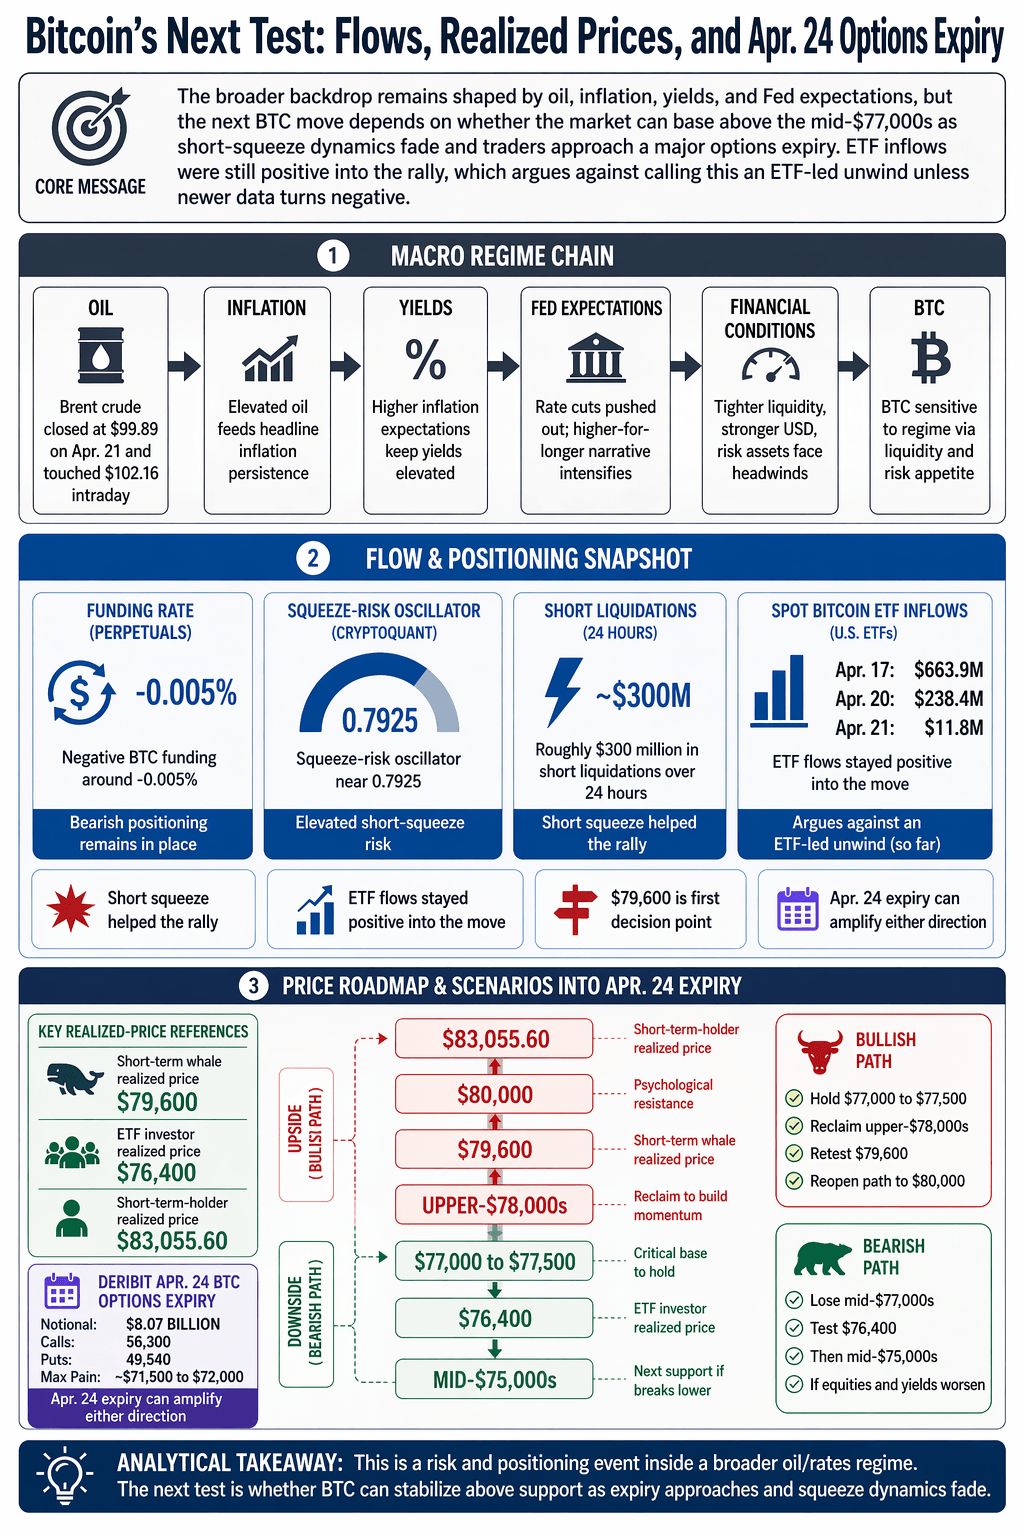
Oil still frames the larger macro problem. In a prior Crypto Findersmarket analysis, Brent crude closed at $99.89 on Apr. 21 and touched $102.16 intraday, while Hormuz traffic was described as severely impaired.

The same analysis linked that energy shock to firmer yields, dollar strength, and a reduced probability of Fed cuts.
That is the route through which oil reaches Bitcoin. Higher energy prices can keep inflation sticky.
Sticky inflation can keep Treasury yields higher. Higher yields and a firmer dollar reduce the liquidity support that risk assets need.
BTC then trades less like an isolated crypto asset and more like a leveraged expression of changing financial conditions.
The rate repricing has already been visible. Crypto Findersreported that markets had moved from pricing in two quarter-point cuts by December earlier in the year to only a 30% chance of one 25-basis-point cut for 2026 as of Apr. 21.
CME FedWatch provides the futures-implied framework behind that kind of rate-probability model.
AP’s earlier April coverage shows why this channel continues to influence cross-asset pricing. When the US and Iran agreed to a two-week ceasefire, oil prices sank, and US stock futures jumped.
In another session, stocks rose after US crude eased from above $102 to a $93.50 settlement. That history explains why traders keep watching oil even when the latest candle points first to equities.
Crypto Findersreported that Bitcoin’s rally toward $80,000 came with negative funding around -0.005%, tight exchange supply, a CryptoQuant squeeze-risk oscillator near 0.7925, and roughly $300 million in short liquidations over 24 hours.

The current CoinGlass liquidation feed is a useful follow-up because it can show whether the next leg is coming from long liquidations or simply from the prior short squeeze fading.
That setup helped the rally. Short sellers who were leaning against BTC had to buy back exposure as price moved higher.
That forced buying can make a rebound look stronger than discretionary demand alone would imply. It also creates a clean failure point.
Once the squeeze slows near resistance, the market has to find follow-through demand.
A second Crypto Findersanalysis described the same standoff from the flow side. It said derivatives traders were still paying to stay short even as spot buyers and ETF flows pushed back.
Farside Investors showed total spot Bitcoin ETF inflows of $663.9 million on Apr. 17, $238.4 million on Apr. 20, and $11.8 million on Apr. 21, with Apr. 22 data still requiring a refresh at the time of review.
Those figures argue against treating the pullback as a clear ETF-led selloff unless later rows change the picture. They show that larger allocators had still been adding exposure to the rally.
If those flows turn negative, the explanation shifts. If they remain positive or only modestly slow, the cleaner interpretation stays focused on profit-taking, equity weakness, and fading forced short-covering near $80,000.
Price Watch For The Next Session
The upper-$79,000s became important because that is where the squeeze met the overhead supply. Crypto Finderscited short-term whale realized price near $79,600, ETF investor realized price around $76,400, and broader short-term-holder realized price around $83,055.60.

Those levels form a practical map. The $79,600 area is the first decision point.
The $83,000 area is the higher validation zone. The $76,400 area is the support reference if the retrace deepens.
The constructive path starts with BTC holding the $77,000 to $77,500 area. If buyers absorb the drop and price reclaims the upper-$78,000s, the next marker is the $79,600 level cited in Crypto Finderss realized-price analysis.
A move through that level would put $80,000 back in play. It would also suggest that the S&P 500 gap failed to break the rally’s structure.
The weaker path starts with a loss of the mid-$77,000s. That would first draw attention to $76,400, then to the mid-$75,000s if equities stay weak or yields firm again.
In that scenario, the recent rally begins to look more like a squeeze into overhead supply than a durable breakout attempt.
Options expiry can amplify either path. Crypto Findersreported roughly $8.07 billion in Deribit BTC options expiring on Apr. 24, split between 56,300 calls and 49,540 puts.
The same analysis placed max pain around $71,500 to $72,000, well below spot, with the Fed meeting, GDP, and PCE data arriving shortly after.
Max pain creates a hedging backdrop, not a destination. If equities stabilize and BTC reclaims the upper-$78,000s, hedging can help drive another squeeze to $80,000.
If equities weaken and BTC falls below $77,000, the same structure can accelerate the downside move as traders and dealers adjust exposure around a large expiry.
The most defensible takeaway is that Bitcoin’s morning drop is a risk and positioning event inside a larger oil/rates regime. The current Bitcoin price chart clearly shows the immediate pressure.
BTC failed to hold the upper-$78,000s after reaching the $80,000 level. The S&P 500 shows the equity side of the same risk-off impulse.
WTI crude stays elevated, yet its latest move remains contained.
That leaves a cleaner map for the next session. Bitcoin needs to hold the mid-$77,000s, regain the upper-$78,000s, and then deal with $79,600 to make the pullback look contained.
A break toward $76,400 would point to a deeper reset, especially if ETF flows soften or equities extend losses.
The oil channel stays active because it feeds inflation, yields, and Fed expectations. The morning spark, however, is showing up first through equities, profit-taking, and a rally that ran into crowded positioning near $80,000.
The post Bitcoin’s loses $78k while the US markets sleeps – risk takes over from oil as crude prices stay flat appeared first on Crypto Finders