Bitcoin just holds $64K after Fed revives hike risk, but one level still decides whether repair is real

The Fed left interest rates unchanged on June 17, and Bitcoin still felt the policy outlook tighten beneath it.
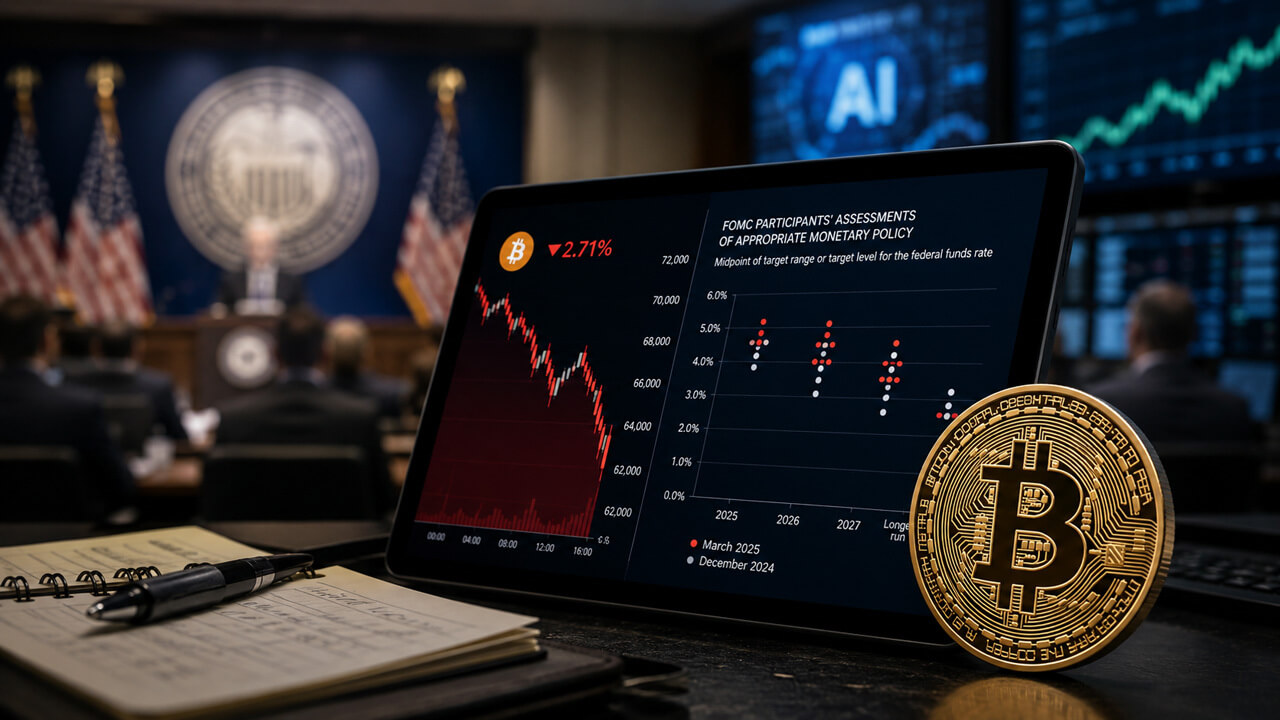
The FOMC voted to hold its target range at 3.50% to 3.75%, but 9 of the 18 submitted dot-plot projections now point to at least one rate hike before year-end, against 8 holding at the current midpoint and only 1 still favoring a cut.
Bitcoin dipped roughly 2%, trading near $64,300 with an intraday low of $63,950, holding within its recent range as traders absorbed a policy outlook that had flipped from rate cuts to rate hikes in the span of three months.
A hold that read like a warning
The FOMC’s June 17 meeting was Kevin Warsh’s first as chair of the committee, and he opted not to submit a personal dot, leaving the published projections at 18, one short of the usual full count.
Rate markets moved immediately to match the shift in tone, with traders pricing 72% odds of a hike by October, while CME data tracked by MarketWatch showed December hike odds jumping to roughly 78% once the dots crossed the wire.
Three months ago, the open question on trading desks was how soon the Fed would cut rates, and recent projections turned that question inside out.
Bitcoin’s pullback fit the shape of a broader risk-off move that touched every major asset class. Dow fell 1.01%, the S&P 500 down 1.28%, and the Nasdaq off 1.45%, while the 10-year Treasury yield climbed to 4.467% and the dollar strengthened.
SPY traded down roughly 1.2%, and QQQ slipped about 1%, as stocks, bonds, and crypto all repriced the same hawkish signal on the same afternoon.
| Market signal | Latest move / reading | Why it matters |
|---|---|---|
| Fed target range | 3.50%–3.75%, unchanged | The Fed did not hike, but the policy outlook tightened. |
| Dot plot | 9 of 18 projections point to at least one hike | Shows the committee is split, with hike risk now back on the table. |
| October hike odds | ~72% | Traders moved quickly to price a near-term hike scenario. |
| December hike odds | ~78% | The market now sees a year-end hike as the dominant path. |
| Bitcoin | Down ~2%, near $64,300 | BTC traded like a high-beta risk asset. |
| S&P 500 | Down ~1.28% | Confirms the move was broader risk-off, not crypto-specific. |
| Nasdaq | Down ~1.45% | Growth and high-beta assets were hit harder. |
| 10-year Treasury yield | 4.467% | Higher yields tightened financial conditions. |
| Dollar | Strengthened | Added pressure to risk assets, including Bitcoin. |
Why the hold still carried weight
Matt Mena, senior crypto research strategist at 21Shares, framed the no-change vote as a formality wrapped around a real signal in a note.
The median dot now points toward a possible hike later this year, a sharp reversal from the cuts markets were still penciling in three months ago, as inflation runs at a three-year high as the energy spike tied to the Iran conflict works through prices.
Mena pointed to the Bank of Japan lifting its policy rate to 1% just a day earlier as an added force, reviving worries about an unwind of the yen carry trade that has quietly propped up risk assets for months.
He also noted Warsh’s distinct profile in digital asset markets, as the first Fed chair with personal ties to crypto, including early investments in multiple projects, and a public fondness for Bitcoin that breaks with his predecessors’ tone.
The roughly 2% dip during the meeting kept Bitcoin inside the $64,000 to $65,000 zone without breaking it, turning that band into the market’s immediate line of defense.
Mena sees $70,000 as the level Bitcoin needs to clear with conviction before a retest of $75,000 and a run at $80,000, the same sequence the asset traced in May, with a third-quarter target near $100,000 sitting at the far end of that bullish path.
| Level | Role | What it would signal |
|---|---|---|
| $60,000 | Lower range / stress zone | A retest would suggest the Fed shock overwhelmed the post-ceasefire rebound. |
| $64,000–$65,000 | Immediate defense zone | Holding here supports the “fragile stabilization” thesis. |
| $68,000 | Negative gamma cluster | Price action here could become more volatile as dealer hedging intensifies. |
| $70,000 | Breakout trigger | A clean move above this level would reopen the $75K–$80K path. |
| $72,600 | Short-term holder cost basis | Recent buyers move closer to breakeven above this area. |
| $77,200 | Glassnode True Market Mean | Structural threshold separating bear-side conditions from pre-bull territory. |
| $80,000 | Bullish momentum target | Confirms a stronger recovery if reached after reclaiming $70K. |
| $100,000 | Bull-case Q3 target | Aggressive upside scenario, not the base case. |
Gerry O’Shea, head of global market insights at Hashdex, offered a more restrained read on the same data.
He expects Bitcoin to keep trading in the $60,000 to $70,000 range in the coming weeks, absent a major catalyst, naming the CLARITY Act’s potential passage into law or further de-escalation in the US-Iran conflict as developments that could break the range.
Sentiment stayed weak as notable IPOs and AI stocks pulled attention away from crypto, in his view, though he expects capital to rotate back as institutional interest expands and regulatory clarity formalizes around stablecoins and tokenization.
What on-chain data adds
Glassnode’s latest weekly report gives the clearest picture of why neither analyst is calling this a clean breakout setup.
Bitcoin trades roughly 15% below the True Market Mean, currently near $77,200, a gap Glassnode treats as the cleanest signal separating a structural bull regime from a structural bear one.
Spot sits near $65,600 against that threshold, and the report states plainly that the on-chain regime stays firmly on the bear side of that line despite the recent bounce.
Short-term holder MVRV recovered from 0.81 to 0.90 over the past week, still short of the 1.0 breakeven mark, with the cohort’s implied cost basis sitting near $72,600 and recent buyers roughly 10% underwater on average.
That leaves a standing pool of potential sellers whenever a rally approaches their entry price. Capital flow tells a similar story, as Realized Cap has contracted 1.45% over the past 90 days to $1.07 trillion, though the 7-day change has nearly flattened at negative 0.18%, a stall that breaks from the steady slide of the prior weeks.
Underneath those still-bearish thresholds, market microstructure looks healthier than it has in weeks.
Glassnode finds spot order books rebuilding on the bid side, with passive buyers absorbing supply more efficiently than during the drawdown toward $60,000.
Implied volatility has normalized sharply across maturities, the options skew has retreated from the extremes hit during the selloff, and the volatility risk premium has flipped negative, as realized volatility now runs above what options markets are pricing in.
The largest negative gamma cluster sits around $68,000, with short gamma exposure ranging from $66,000 to $71,000, while positive gamma sits much higher in the high $70,000s.
| Glassnode metric | Current reading | Bullish confirmation needed | Interpretation |
|---|---|---|---|
| True Market Mean | ~$77,200 | BTC reclaims this level | Bitcoin remains structurally below the bull-regime threshold. |
| Distance from True Market Mean | ~15% below | Gap narrows or flips positive | Spot price has not repaired enough to confirm a regime shift. |
| Short-term holder MVRV | 0.90 | Above 1.0 | Recent buyers are still underwater. |
| STH cost basis | ~$72,600 | BTC trades above it | Reclaiming this level would reduce overhead supply from recent buyers. |
| Realized Cap | $1.07T | 90-day growth turns positive | Capital is still contracting, though the pace is slowing. |
| 90-day Realized Cap change | -1.45% | Positive trend | Confirms whether fresh capital is returning. |
| 7-day Realized Cap change | -0.18% | Stabilizes or turns positive | Suggests capital outflows are slowing. |
| Spot liquidity | Improving | Bid depth keeps rebuilding | Passive buyers are absorbing supply more efficiently. |
| Options skew | Normalizing | Protection demand stays contained | Forced bearish hedging pressure is easing. |
Two paths from here
A bullish path has Bitcoin clearing $70,000 with enough conviction to retest $75,000 and challenge $80,000, the same move Mena flagged from May’s pattern.
That kind of advance would also start with short-term holder MVRV pushing back above 1.0, Realized Cap turning positive on a 90-day basis, and spot eventually testing the $77,200 True Market Mean that currently separates bear from pre-bull territory.
Easing hike odds or further de-escalation in Iran could supply the catalyst O’Shea says the range currently lacks.
A more cautious path keeps Bitcoin inside the $60,000 to $70,000 band O’Shea describes, with the Fed’s hawkish dots and Treasury yields near 4.5% capping any rally before it reaches the $68,000 gamma cluster that’s already drawing dealer hedging activity.
Along this path, short-term holders stay underwater, Realized Cap keeps contracting even as the pace slows, and capital that might otherwise flow into Bitcoin keeps chasing the IPOs and AI stocks O’Shea points to as the current competition for investor attention.
Bitcoin’s reaction to the Fed looks like a defended level, and Glassnode’s data points to repair still in progress. The asset is trading in the mid-$60,000s as passive buyers return, volatility normalizes, and forced selling fades.
Until it reclaims the cost basis of its most recent buyers and pushes back toward the $77,200 True Market Mean, the more accurate description for Bitcoin’s state is a fragile stabilization.
The post Bitcoin just holds $64K after Fed revives hike risk, but one level still decides whether repair is real appeared first on Crypto Finders