
TLDR
Bitcoin rose above $64,000 after buyers defended the $63,300 support level.
Analyst Michael van de Poppe expects a move toward $65,000 if the recovery holds.
Bitcoin’s implied volatility sits in the lowest 2% of its historical range.
Glassnode’s “volatility trap” score hit 91, the highest reading in over three years.
Liquidity clusters near $64,700 and $62,200 mark the next key price zones.
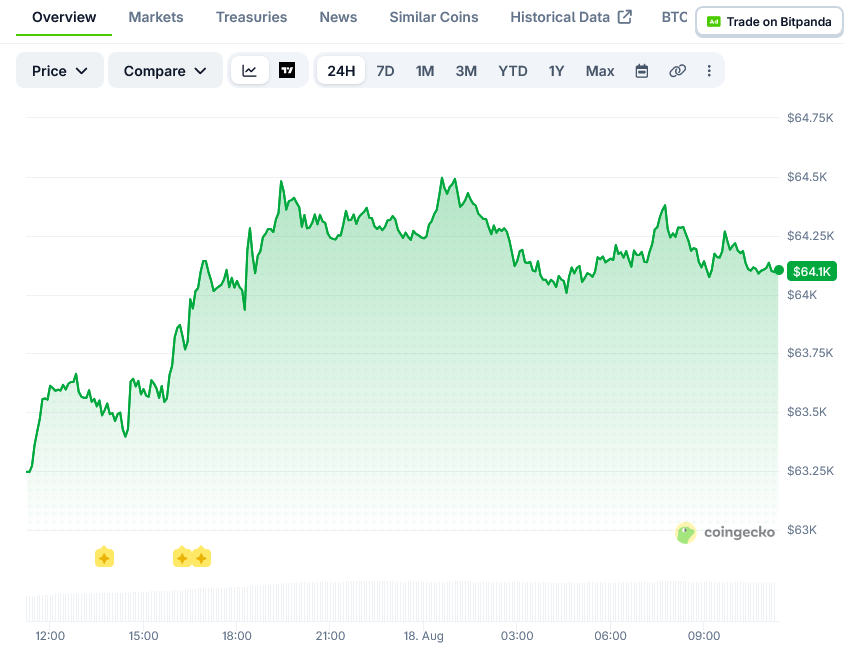
Bitcoin’s price climbed nearly 2% on August 17, moving back above $64,000. Buyers stepped in near $63,300 to defend that level.
The bounce improved the short-term outlook. Weak daily momentum and low volatility still leave the next big move unclear.
Analyst Michael van de Poppe shared his view on X. He said Bitcoin’s bounce off $63,300 was important for further gains.
Van de Poppe explained that Bitcoin tested the level and was bought quickly. He said another test of that price would be a sign of weakness.
He expects Bitcoin to move toward $65,000 if the recovery continues. His tweet framed the $63,300 level as the line that matters most right now.
Volatility Drops to Rare Levels
Rafael Schultze-Kraft, co-founder of Glassnode, flagged an unusual pattern in the options market. Bitcoin’s implied volatility sits at the 2nd percentile of its historical range.
Implied volatility shows how much price movement traders expect ahead. It does not say whether that movement will be up or down.
Schultze-Kraft said implied volatility is still about 1.5 times higher than realized volatility. Realized volatility tracks how much price has actually moved recently.
This gap shows options traders are still paying a premium for future movement. That’s true even though Bitcoin’s trading range has stayed tight.
Glassnode’s “volatility trap” score hit 91 out of 100. That is the highest reading in more than three and a half years.
Low implied volatility does not always mean options are cheap. Realized volatility fell even faster, so the relative premium stayed high.
Past periods of tight volatility have often come before sharp price swings. Glassnode’s data does not show which direction the next swing might take.
Liquidity Levels on Both Sides
Bitcoin has traded between $62,000 and $65,000 since late July. A few short moves outside that range have not led to a breakout.
CoinGlass’ weekly liquidation heatmap shows leveraged positions stacked above and below the current price. The nearest resistance sits near $64,000, with a larger cluster around $64,700.
A move through those levels could trigger a short squeeze. That would add buying pressure and push Bitcoin toward $65,000.
On the downside, liquidity sits at $62,700 and $62,200. A rejection at current levels could send price toward those areas and liquidate leveraged long positions.
Those clusters mark spots where forced position closures are more likely. They do not confirm a breakout in either direction.
The liquidity heatmap points to a near-term range between $62,200 and $64,700. Bitcoin’s price remains inside strengthening support and historically tight volatility.
