While Bitcoin has dipped from its recent highs of around $74,000, some analysts are urging investors to stay calm and even see this as a buying opportunity. So far, Bitcoin prices have remained under pressure, trickling lower in the past trading week.
Are There Similarities With The Bitcoin Bull Run Of 2020?
Though the downward momentum is slowing down, and there has been no confirmation of the April 2 dump, the failure of bulls to convincingly flow back and drive the coin above $71,000 remains a concern for some traders.
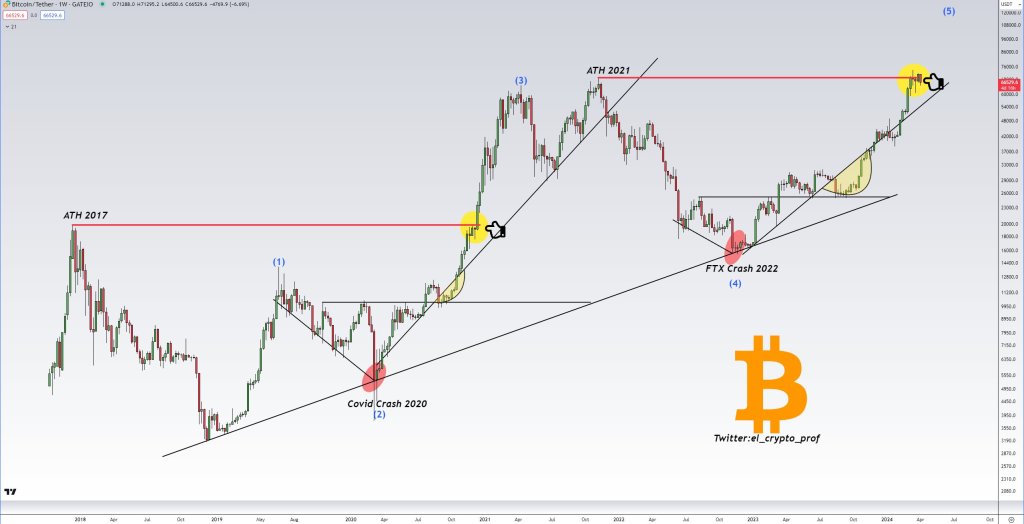
Even so, taking a bullish stand, one analyst on X compares the current formation with that of 2020. Pointing to the cyclic nature of prices and the inevitability of retracements from bottoms and peaks, the trader expects prices to bounce.
The trader said that in 2020, when Bitcoin prices fell, shaking out weak hands, the recovery sparked a bull run that forcefully saw the coin surge above previous all-time highs of $20,000. The analyst seems to allude to the retracement before the breakout as a catapult that eventually fed the “legendary” bull run, which saw Bitcoin float to as high as $70,000.

Based on this comparison, the trader is adamant that it may, reading from history, be the best time to “sell” at around spot levels. Still, for now, buyers can consider doubling down until there is a clear trend definition and shake-off of the current bear formation. Currently, BTC has strong rejections in the $71,700 to $72,000 liquidation zone, marking last week’s highs.
Watch Out For The “Dry Powder”
Besides technical candlestick formation, another trader thinks buyers better HODL even with sellers in control.
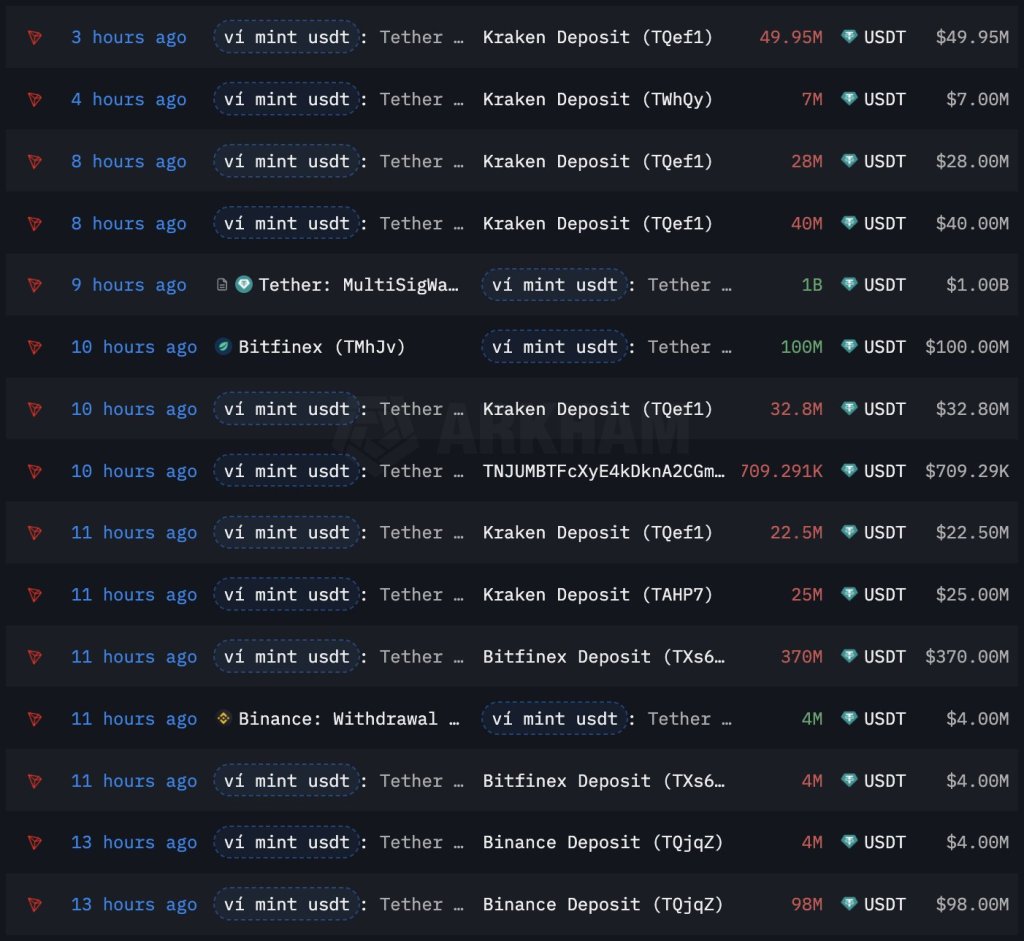
In a post on X, the analyst said Tether Holdings, the issuer of USDT, and Circle, the issuer of USDC, recently minted billions. On April 2, Tether issued 1 billion USDT on Tron, while Circle issued 250 million USDC on Solana.
This development, the analyst said, means there is “plenty of dry powder.” Stablecoins like USDT and USDC offer stability in the crypto markets, providing a refuge for crypto holders whenever prices tumble.

However, they can also act as conduits of liquidity from the traditional market, providing an avenue for interested users to get exposure to top coins or even engage in activities such as decentralized finance (DeFi).
In the past, prices often edged higher when there were huge stablecoin mints.
Feature image from Canva, chart from TradingView
Disclaimer: The article is provided for educational purposes only. It does not represent the opinions of NewsBTC on whether to buy, sell or hold any investments and naturally investing carries risks. You are advised to conduct your own research before making any investment decisions. Use information provided on this website entirely at your own risk.
