On-chain data shows the Bitcoin short-term holder SOPR is approaching the “breakeven” value, a point that has acted as resistance for the crypto’s price in the past.
Bitcoin Short-Term Holder SOPR Surges Up And Approaches A Value Of “1”
As pointed out by an analyst in a CryptoQuant post, the selling pressure from the short-term holders may see an increase if their SOPR keeps rising up.
The “Spent Output Profit Ratio” (or SOPR in short) is an indicator that tells us whether the Bitcoin market as a whole is currently selling at a profit or at a loss.
The metric works by going through the on-chain history of each coin being sold to see what price it sold at before this. If the previous value of any coin was less than the current price, than that coin moved at a profit just now.
While the last selling price being lesser than the latest one would imply the sale of the coin lead to a realization of loss.
When the SOPR’s value is greater than one, it means the overall market is selling at a profit at the moment. On the other hand, values below the threshold suggest the average investor is moving BTC at a loss.
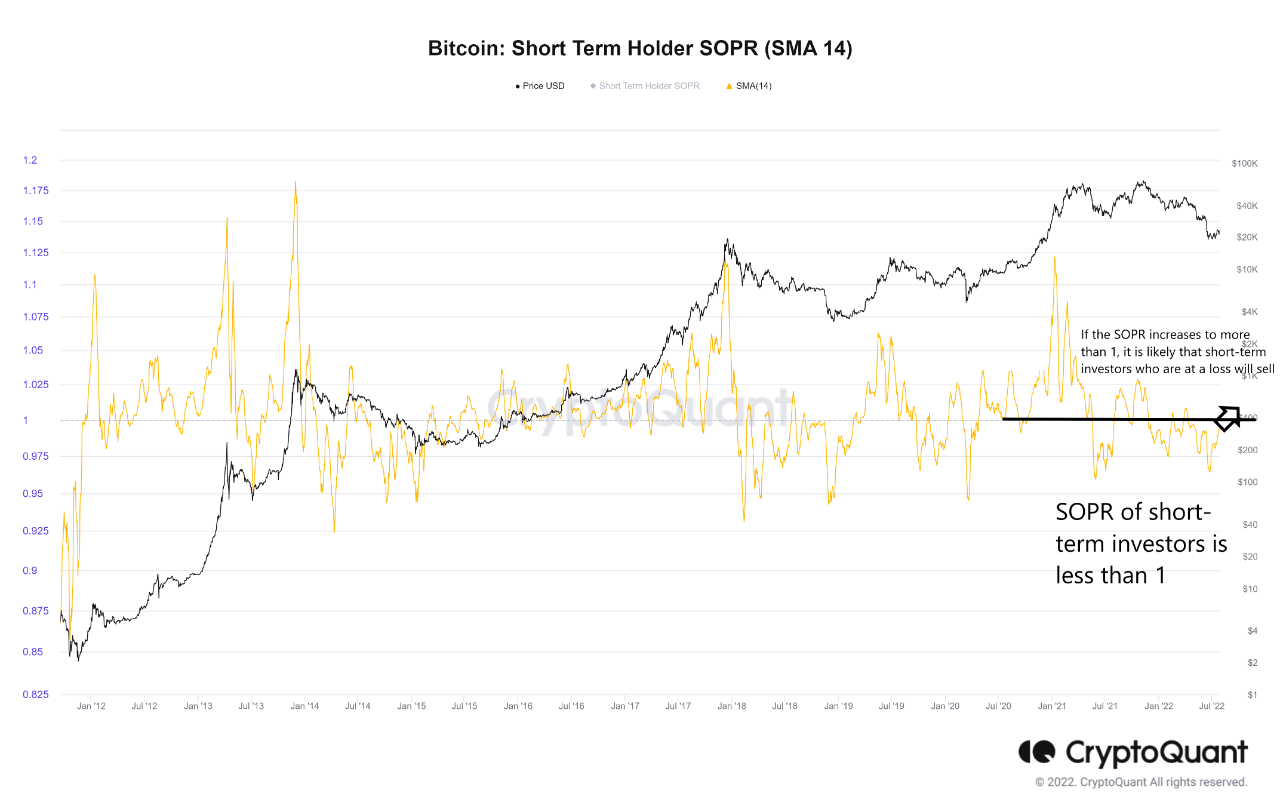
Now, the “short-term holders” (STHs) include all Bitcoin investors who sell their coins after holding them for less than 155 days. The below chart shows the trend in the SOPR specifically for this cohort.

The value of the metric seems to have observed some rise in recent days | Source: CryptoQuant
As you can see in the above graph, the Bitcoin STH SOPR sunk down below “1” a few months back, suggesting that these holders were selling at a loss.
During these last few months, the indicator has tried to escape this zone twice, but both times it failed and the price also simultaneously went down.
The reason behind this trend is that the “SOPR = 1” line represents the “breakeven” point for the market. As the metric hits this level, investors who had previously been at loss think they have now got their money “back” and thus sell their coins here.
This leads to a higher than usual selling pressure from the STHs at this mark, which provides resistance to the price of Bitcoin.
Recently, the SOPR for this holder group surged up and is now approaching the threshold once again. If past trend is anything to go by, once it tests the value, BTC may see some downtrend this time as well.
BTC Price
At the time of writing, Bitcoin’s price floats around $23.7k, up 5% in the last seven days.

Looks like the price of the coin has been consolidating sideways during the last few days | Source: BTCUSD on TradingView
Featured image from Amjith S on Unsplash.com, charts from TradingView.com, CryptoQuant.com
