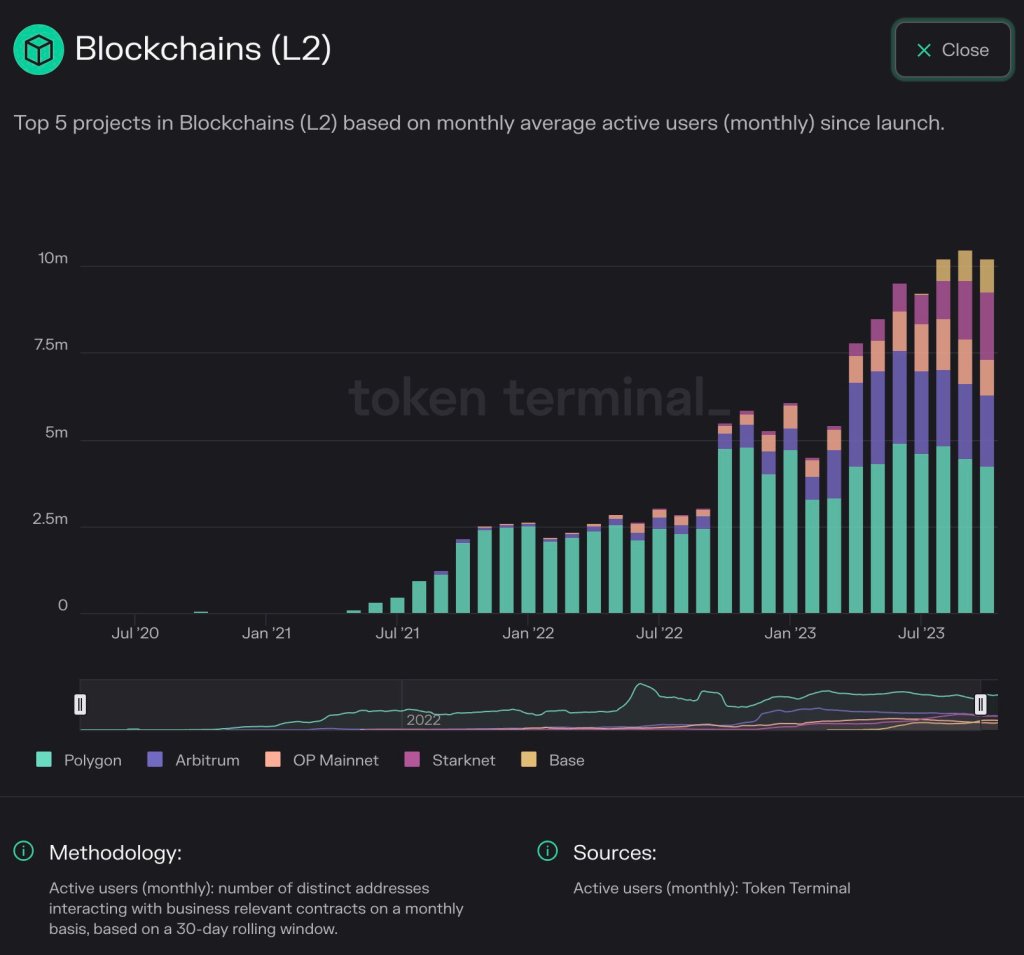
The adoption of Ethereum layer-2s is on the rise if Token Terminal data shared on November 6 is anything to go by. According to statistics from the blockchain analytics platform shared by Erik Smith, the Chief Investment Officer (CIO) of 401 Financial, the average active addresses over the past three months has exceeded 10 million, a nearly 2X expansion from early 2023.
Related Reading: Can The ADA Price Climb Above $20 In The Bull Market? Analyst Provides Answers
Ethereum Layer-2s Finding More Adoption
Looking at the chart, Polygon, an Ethereum sidechain, remains the most popular. At the same time, Arbitrum and OP Mainnet, which are common layer-2s adopting the roll-up technology, are actively being used.
Even so, OP Mainnet’s share is gradually dropping. Base, a layer-2 backed by Coinbase, and StarkNet are also finding adoption, expanding their share over the past three months.

In crypto, active addresses refer to the number of unique wallet addresses (sending and receiving) that have interacted with the blockchain, in this case, Ethereum, over a given period.
An uptick or contraction in the number of active addresses can be used to measure sentiment and the level of uptake. In bear markets, active addresses tend to drop, only rising when bulls flow in, pointing to a possible scramble for arising opportunities.
The recent uptrend coincides with the rapid expansion of leading crypto prices. Ethereum (ETH) prices are inching closer to the $1,870 resistance level, with a breakout above this line a potential trigger for a leg up that might see the coin retest $2,100 and even register new 2023 highs.
Usually, rising crypto prices tend to revive demand as the number of active addresses and, in some instances, the total value locked (TVL) in decentralized finance (DeFi), and more.
What Will Happen To Gas Fees?
Ethereum is the world’s most active smart contract platform, stretching its dominance mainly because of its first-mover advantage. The blockchain anchors more DeFi, non-fungible tokens (NFTs), and gaming activity. Deploying protocols, depending on their objectives, can either directly launch on the mainnet or layer-2s.
The mainnet is directly secured by validators, while layer-2 solutions depend on the mainnet for security but often re-route transactions off-chain. In this arrangement, more transactions can be processed cheaply and efficiently, relieving the mainnet.
Though the Ethereum base layer is secure, its peak transaction throughput remains relatively lower at around 15 TPS. This means during peak demand, gas fees tend to be higher, impacting user demand.
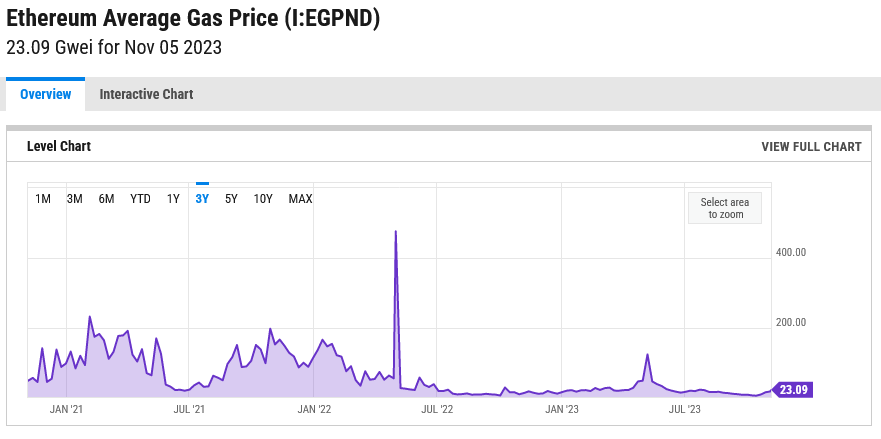
Still, Ethereum gas fees remain at a multi-year low at around 23 Gwei, according to trackers, as seen on the chart below. This is down from 240 Gwei recorded in February 2021 when crypto assets rapidly rose.

For now, whether gas fees will increase as the market recovers is yet to be seen. What’s evident is that as users opt for layer-2s, the mainnet will likely be relieved, keeping gas fee fluctuation low.
Feature image from Canva, chart from TradingView
