In recent discussions surrounding Bitcoin (BTC) and its potential future price trajectory, crypto-enthusiasts and analysts alike are finding new correlations to dissect. Most notably, a correlation with the EURUSD pair (the euro against the US dollar) has come into the spotlight due to a Twitter thread by esteemed analyst Josh Olszewicz.
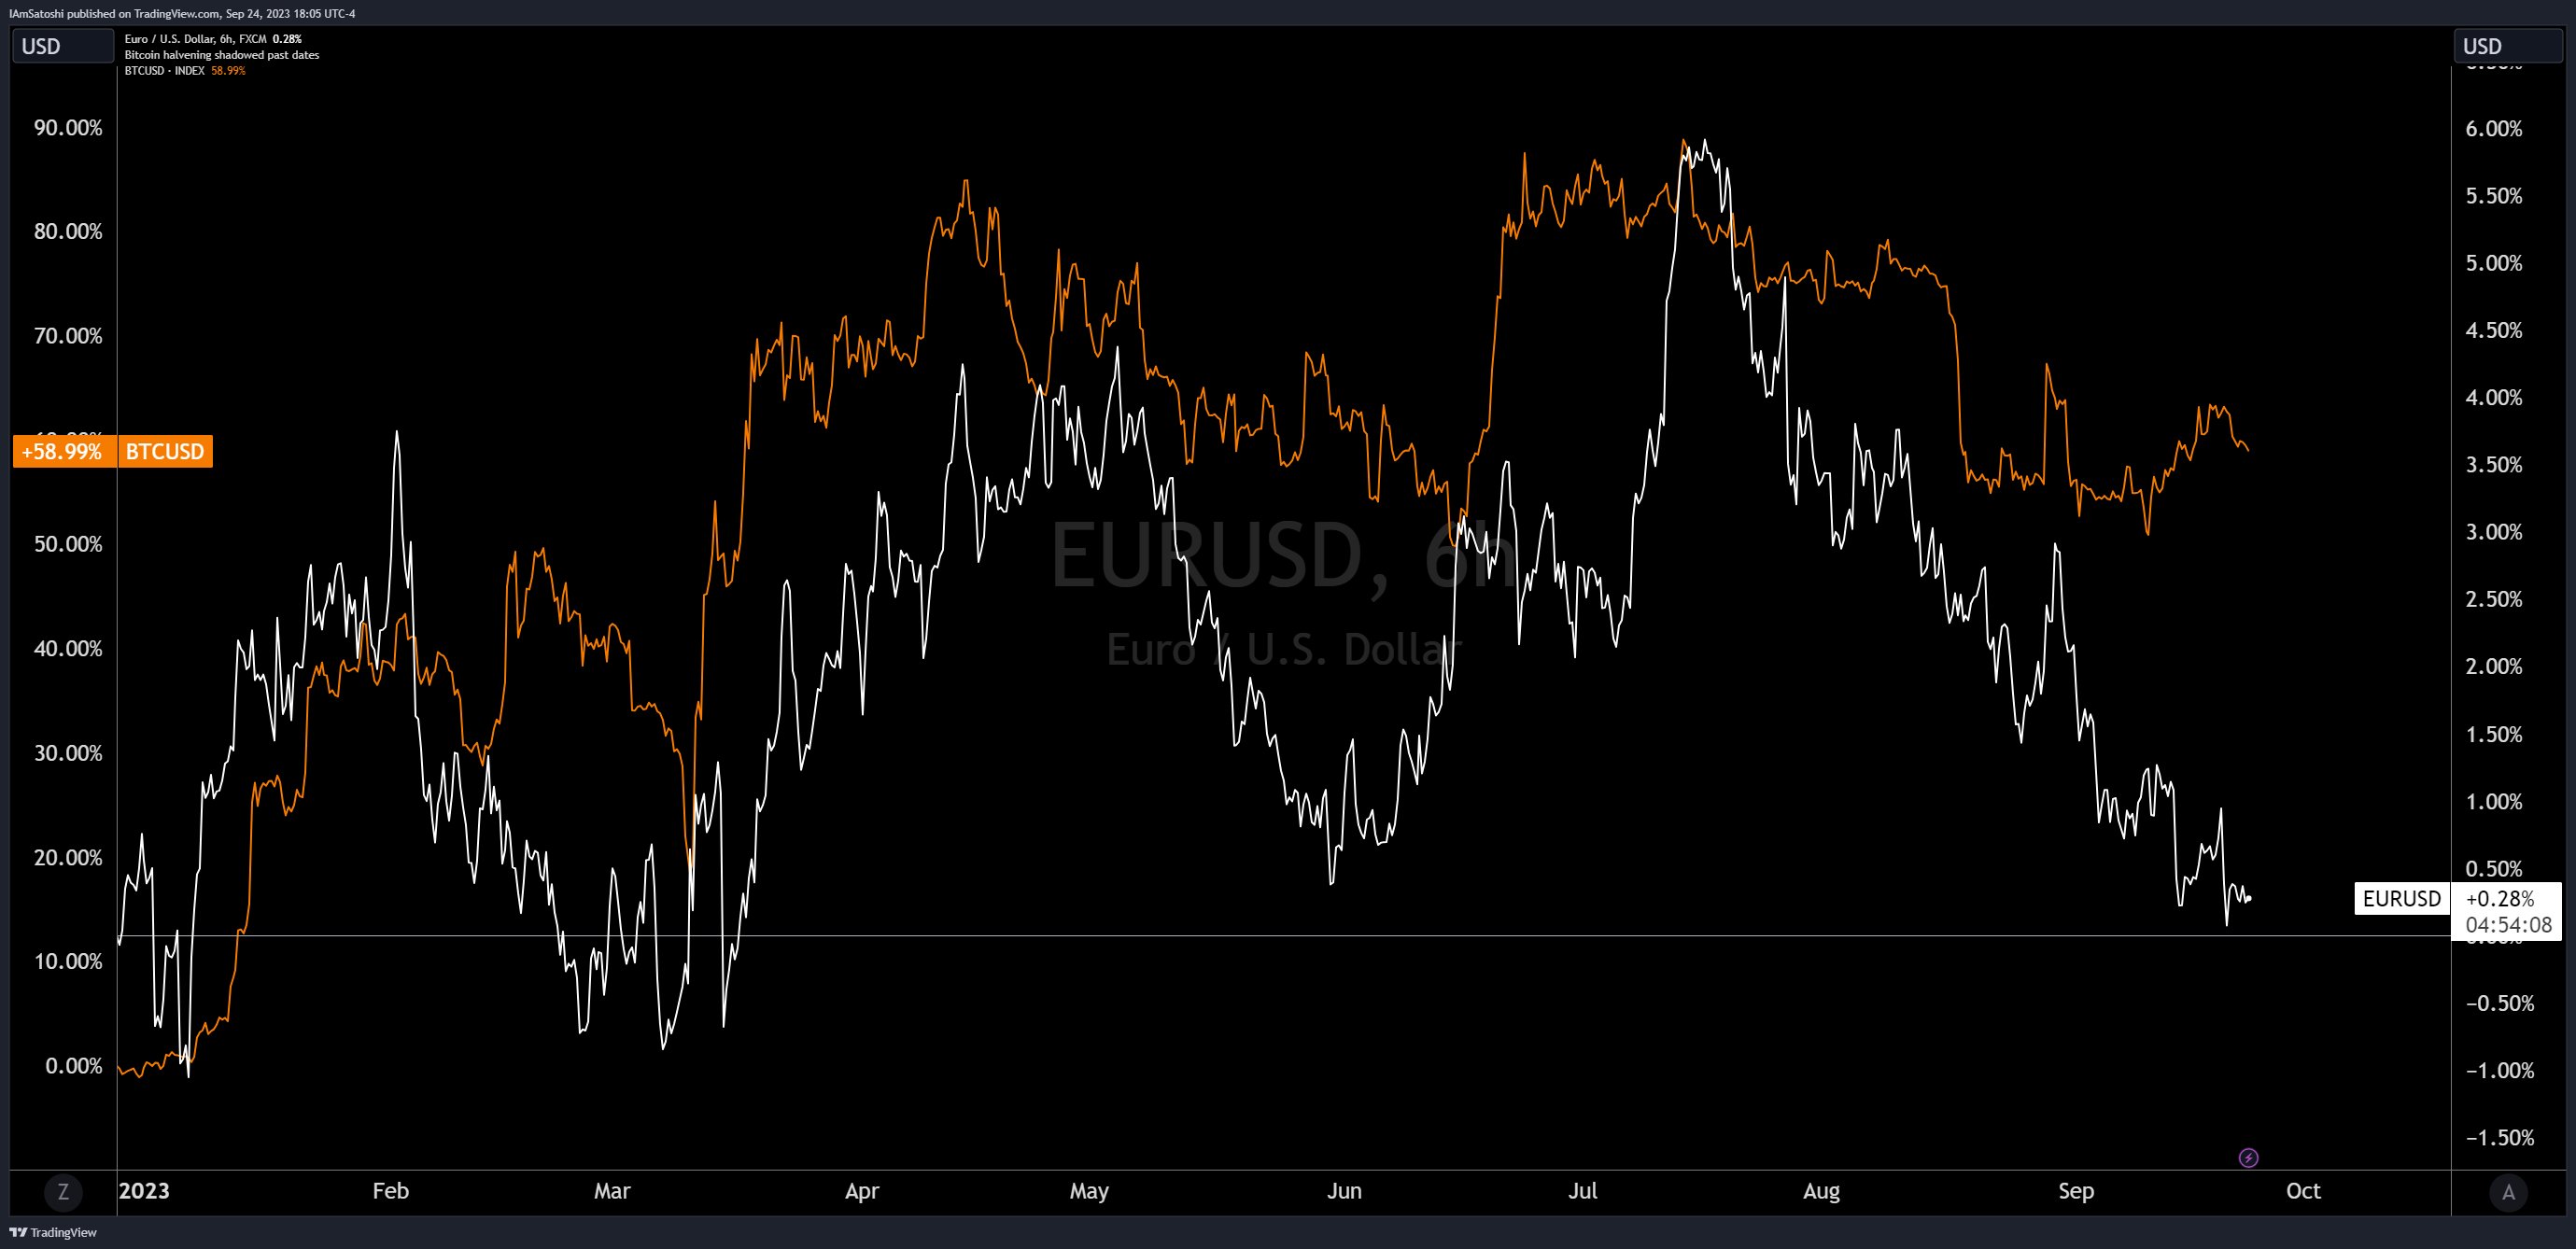
Olszewicz begins by setting the stage, drawing attention to the widely acknowledged inverse correlation between Bitcoin and the DXY (US Dollar Index). He notes, “Most are aware of the strong historic BTC-DXY inverse correlation. DXY is a USD index against a basket of currencies which has a EURUSD weighting of around 58%. So the BTC-EURUSD correlation should also be relatively high.”
Will Bitcoin Price Follow EURUSD?
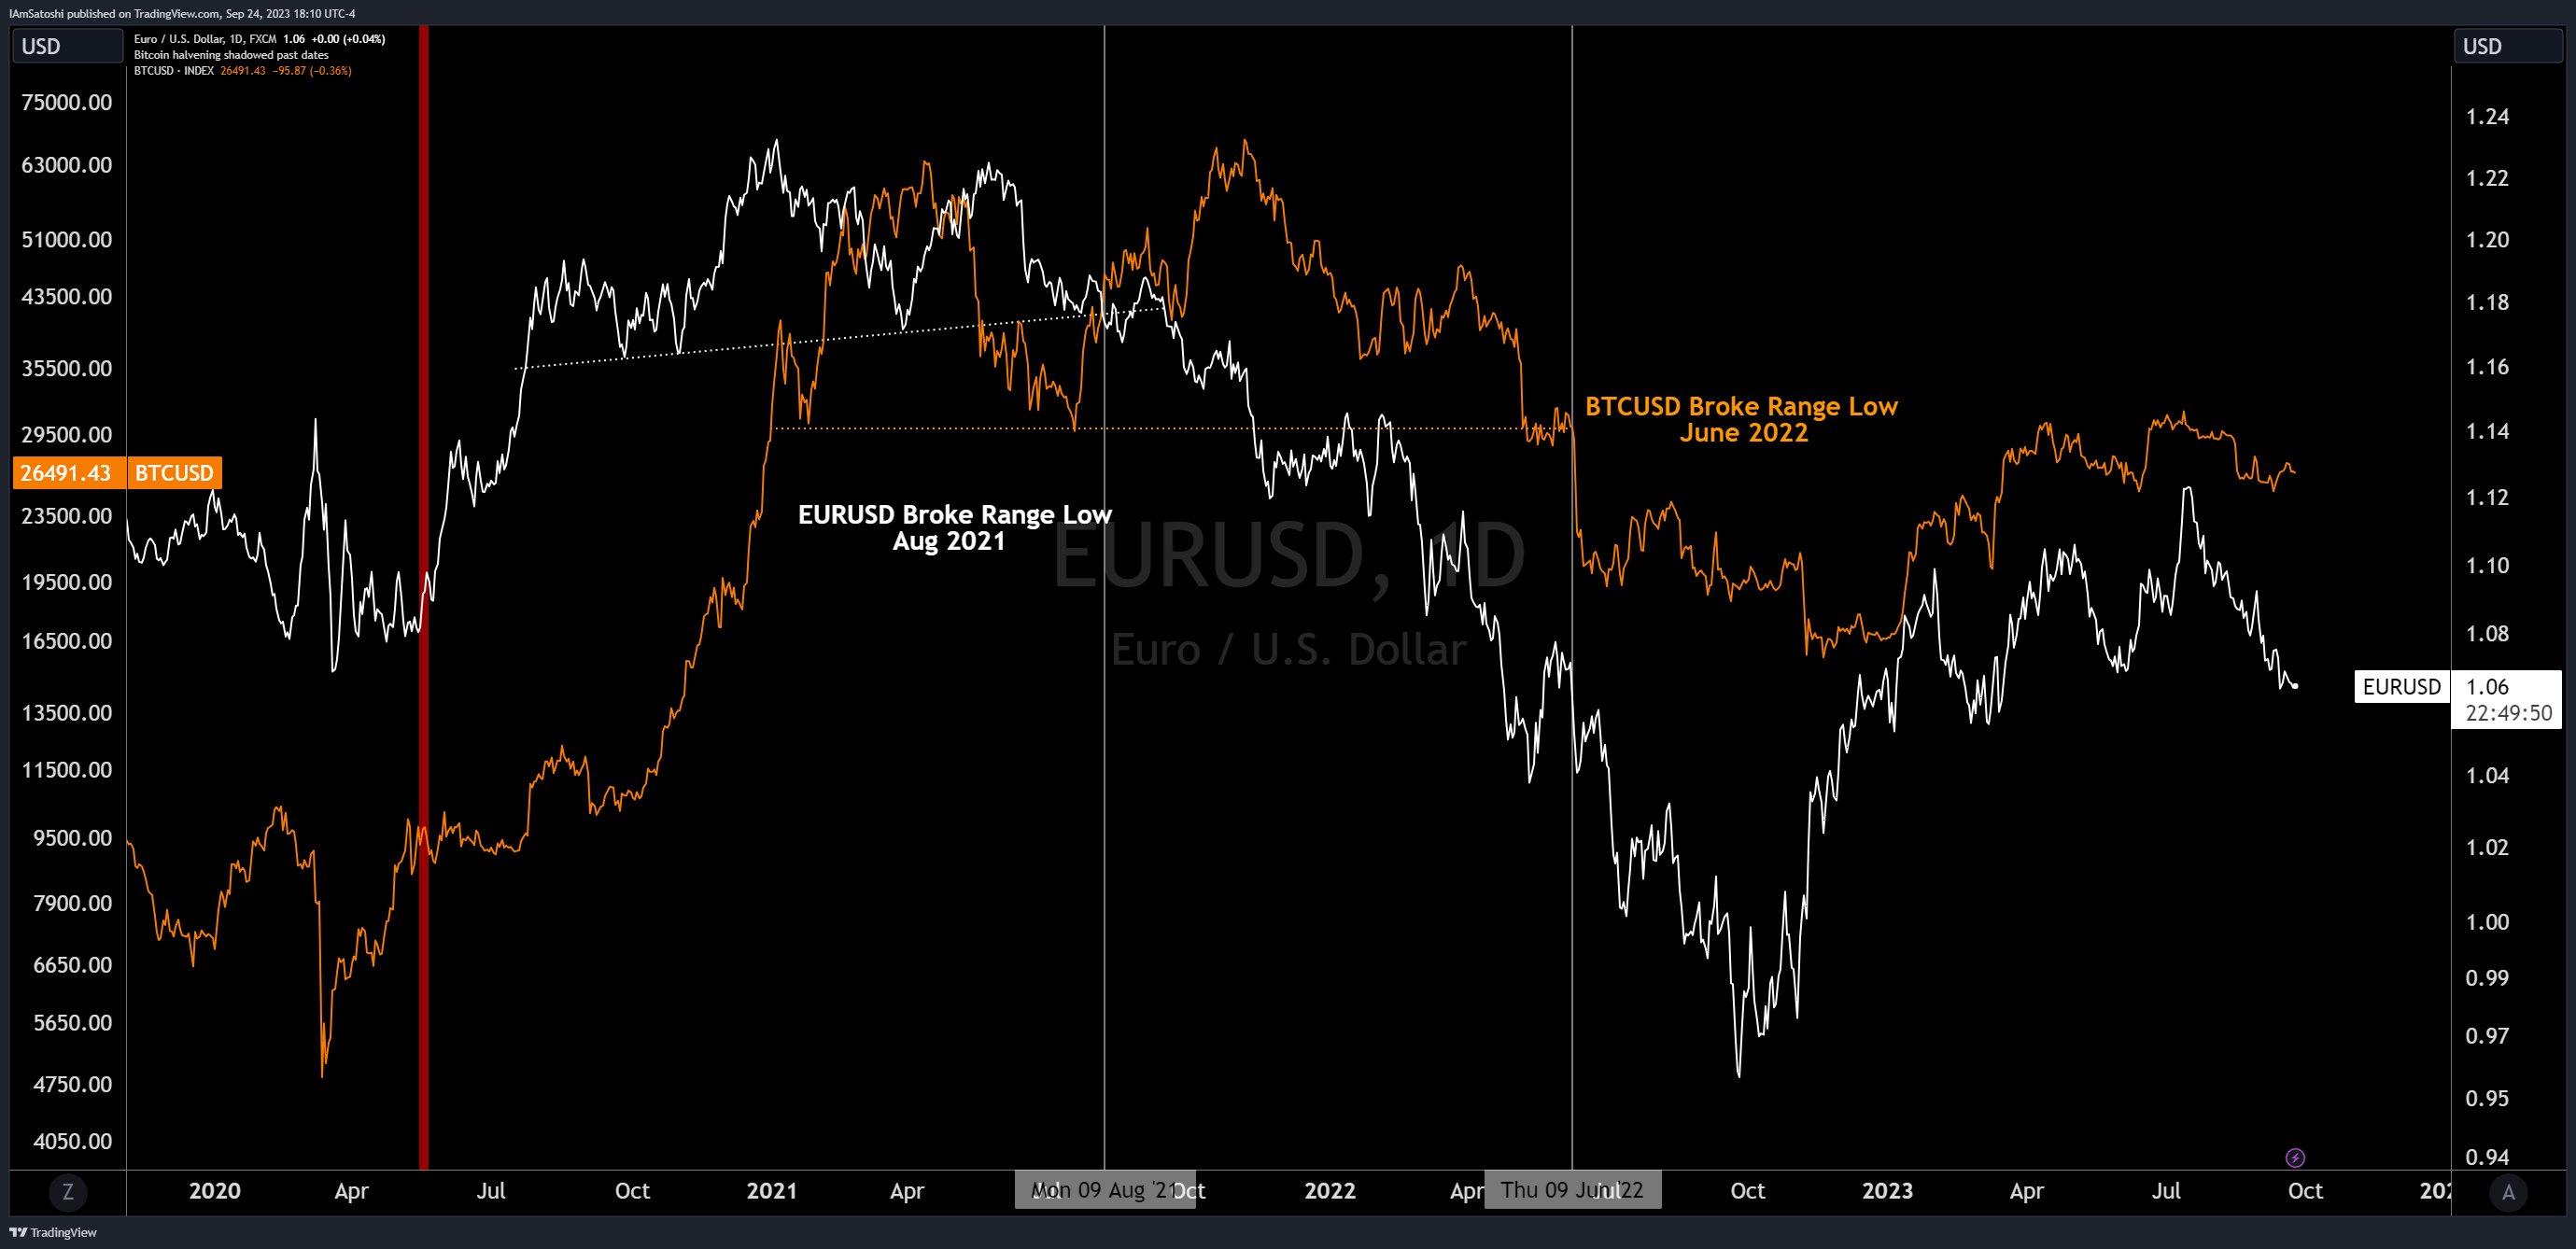
What’s intriguing here is the observation Olszewicz makes about the BTC-EURUSD correlation in the period following the pandemic and the last Bitcoin halving. He mentions that the “post-pandemic (post-halving) EURUSD pair has led BTC in both the bullish and bearish direction by anywhere from a month to a full year.”

This pattern, if it continues to persist, might spell some bearish tendencies for Bitcoin. Olszewicz goes on to suggest that, “If this relationship continues to hold, BTC should break down towards the BTFP low of $20k.” This statement is a significant one, indicating a potential substantial drop from its current position, all based on the movement patterns of the EURUSD.
Further supporting this projection, he highlights a technical pattern observed in both BTC and EURUSD, stating, “the EURUSD has completed a bearish H&S, similar to BTC, providing technical fuel for further downside.” A ‘bearish H&S’ refers to the bearish ‘head and shoulders’ pattern, a chart formation that predicts a bullish-to-bearish trend reversal.
However, it’s not all gloom and doom. Olszewicz does provide a glimmer of hope for Bitcoin bulls. He posits, “If you’re bullish on BTC here, you’re either hoping this relationship weakens/breaks, or the EURUSD begins to strengthen instead of continuing to weaken.”
BTC’s Second High Does Not Fit
Olszewicz also touches upon some “tin foil” speculations, discussing how the BTC-EURUSD correlation had been seemingly disrupted during Bitcoin’s second high in November 2022. He suggests that the continued fall of EURUSD did not immediately impact Bitcoin’s bullish trend, speculating that actions from major crypto players like 3AC, FTX/Alameda, and the Anchor BTC reserve might have played a role.
He states, “It is both possible and likely that the funny business behind the scenes by 3AC & FTX/Alameda, as well as the Anchor BTC reserve, helped delay the inevitable bearish trend by about a year.”

While correlations can provide insight, they are by no means a guarantee of future market movements. Investors should exercise caution and conduct their own research when making investment decisions. Rose Premium Signals added, “interesting observation about the BTC-EURUSD correlation. It’s essential to consider multiple factors in crypto analysis. The relationship could indeed evolve, impacting BTC’s future movements.”
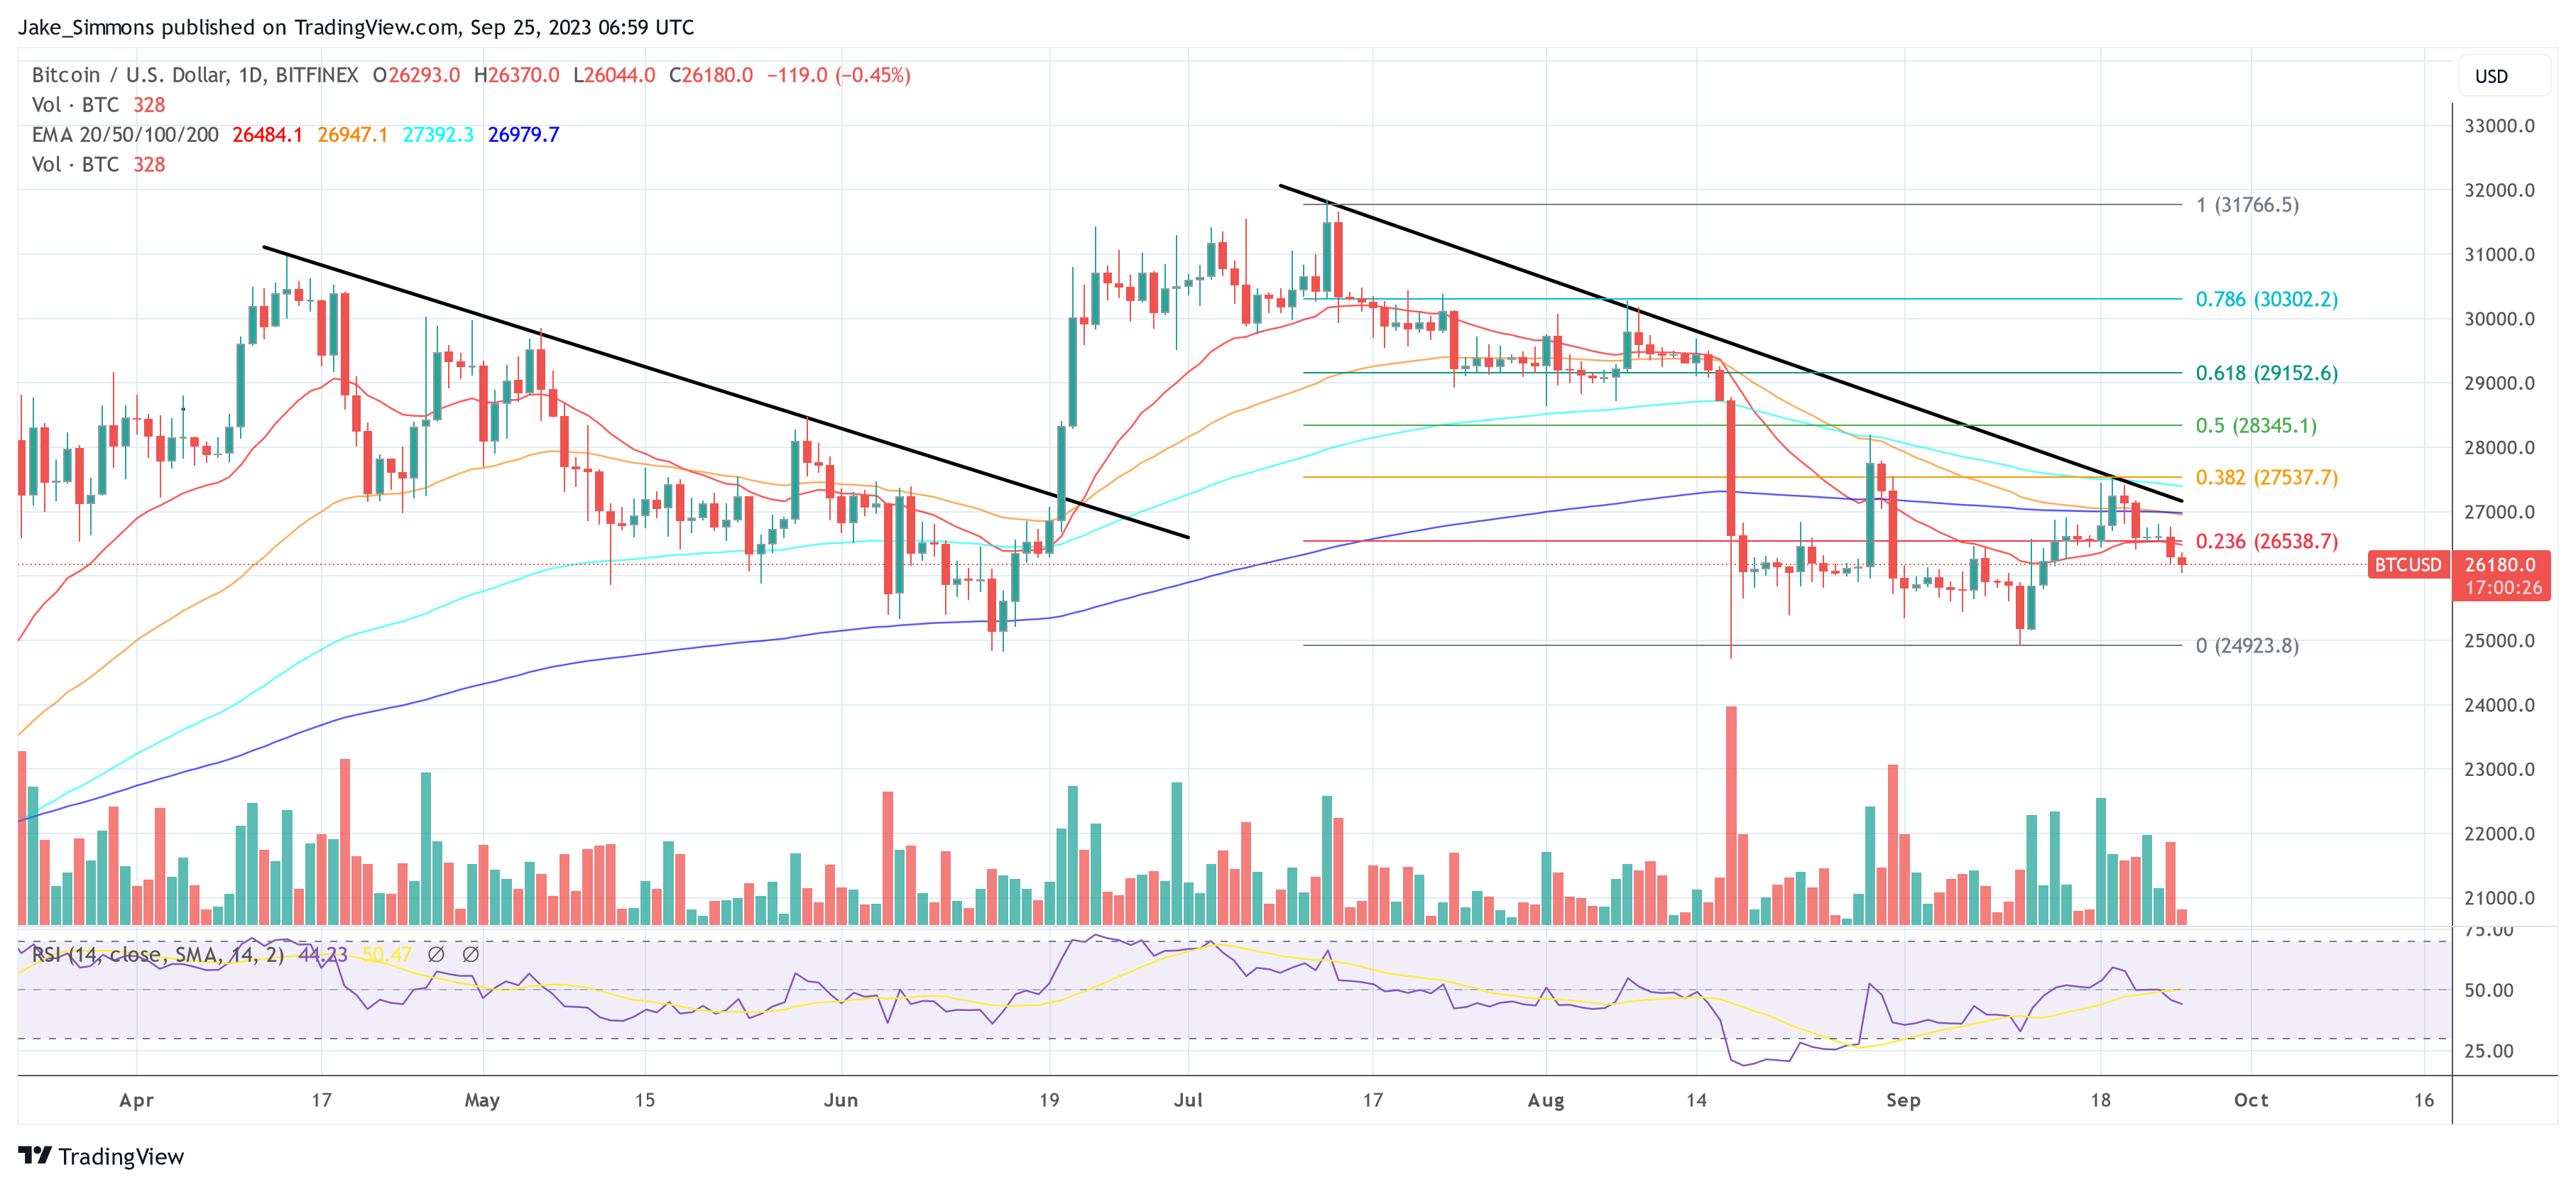
At press time, BTC stood at $26,180.

Featured image from iStock, chart from TradingView.com
