In the Bitcoin space, one question echoes persistently through the minds of enthusiasts and investors alike: When will Bitcoin rocket to the moon? While no one knows the answer, there are on-chain metrics and historical patterns that can be followed to track down the answer.
Bitcoin Price Analysis: When Will BTC Break Out?
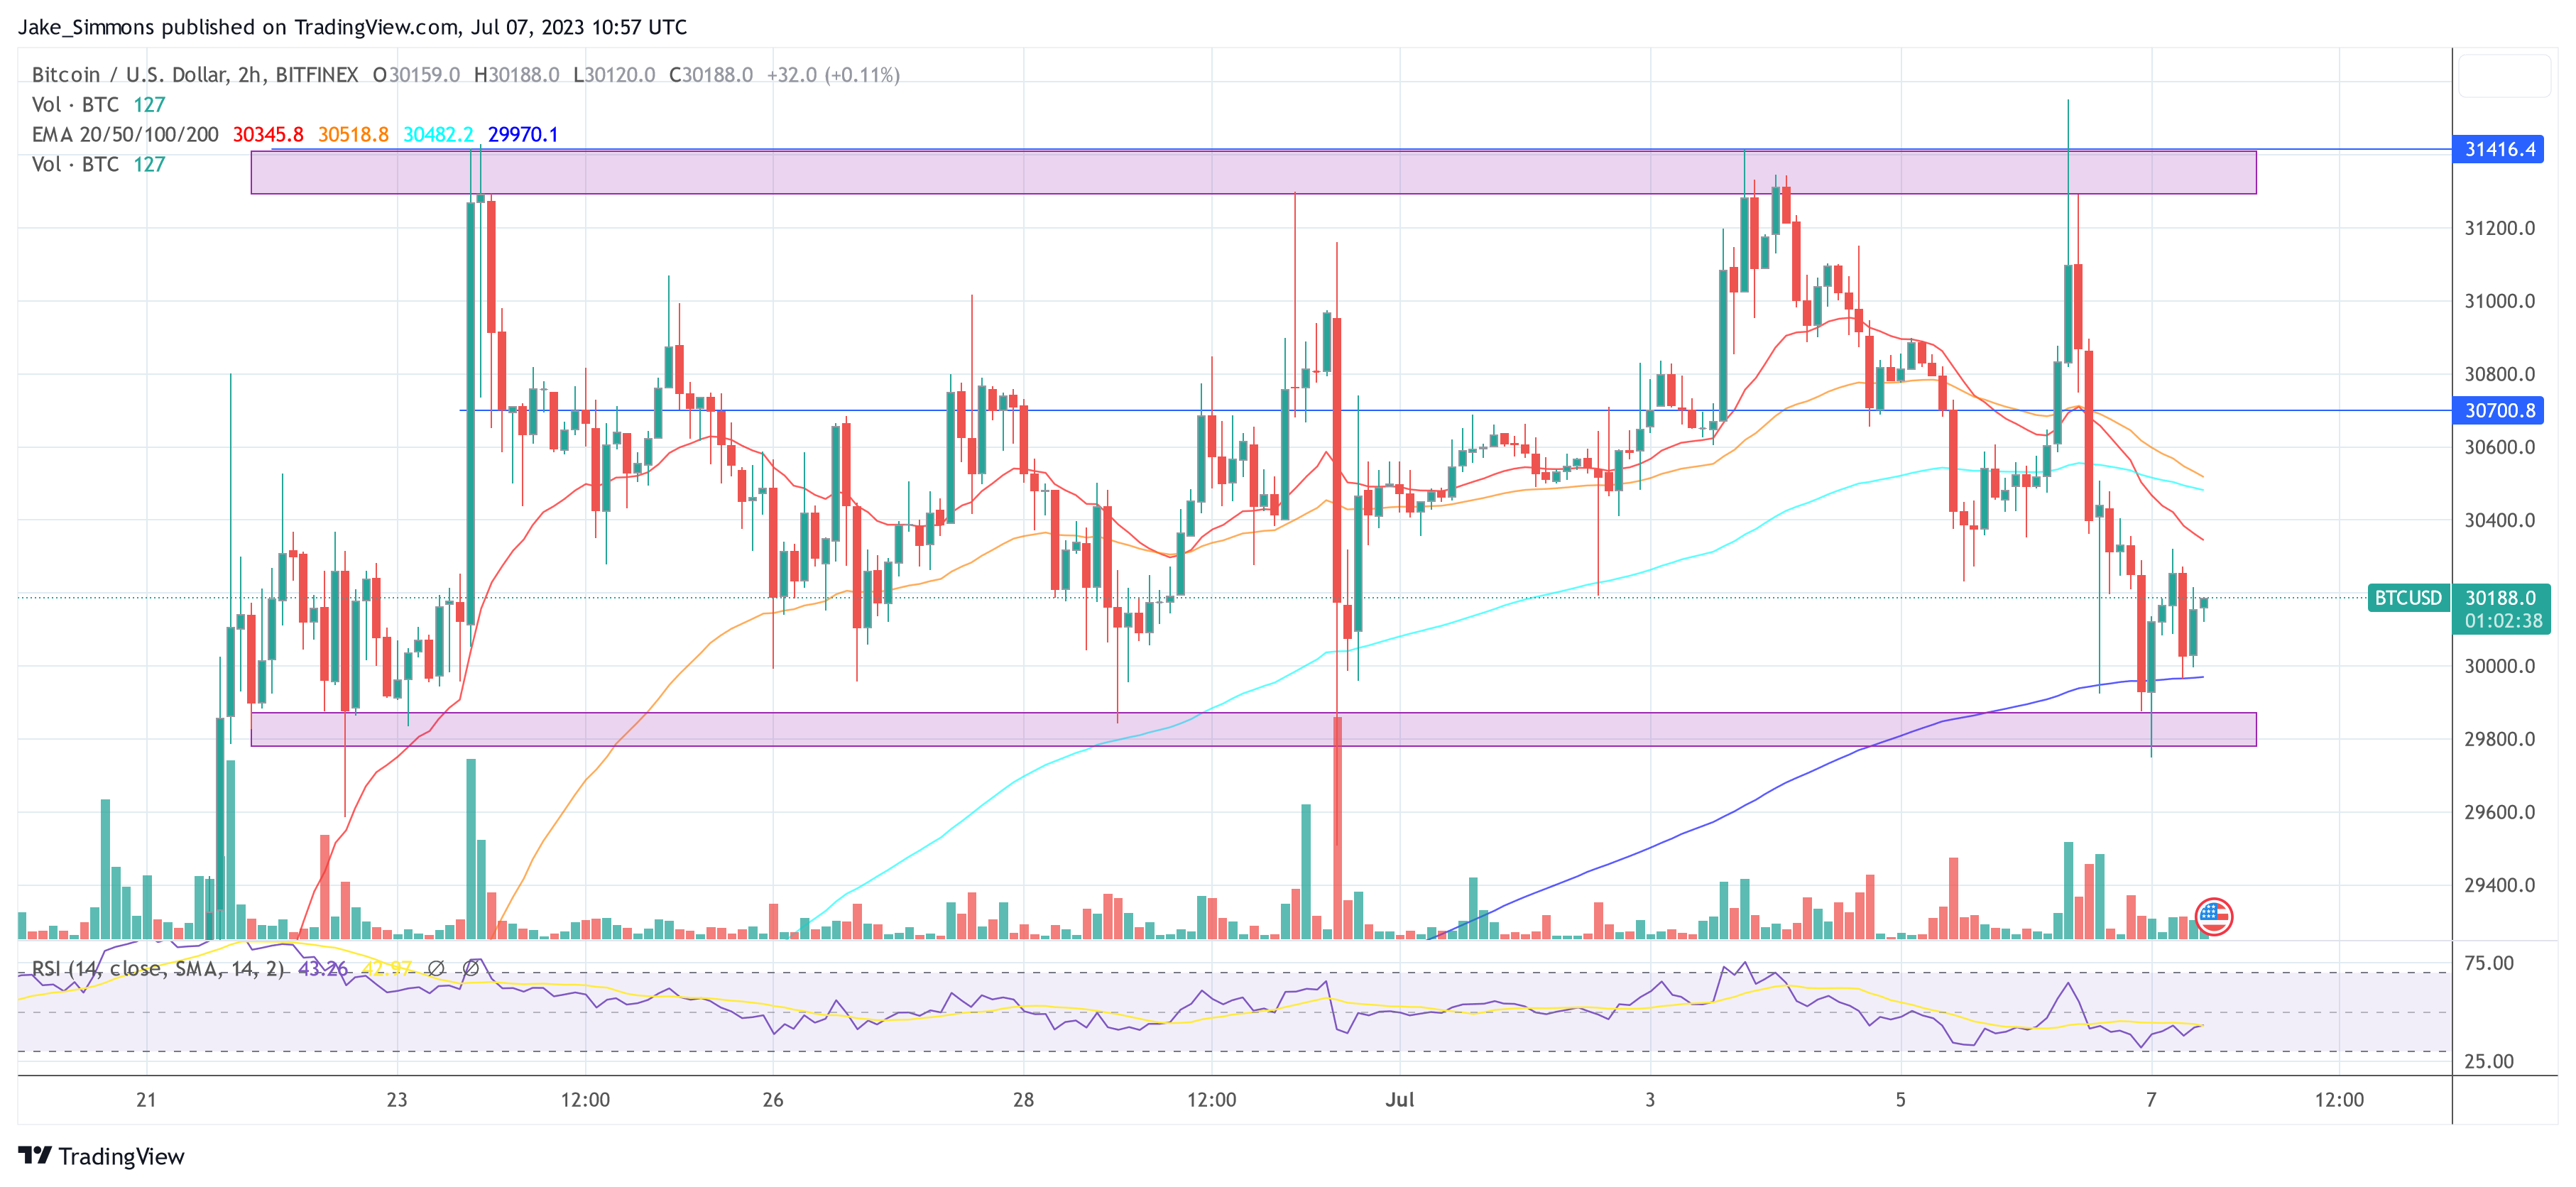
Over the last two weeks, the Bitcoin price has been in a sideways trend. After the Bitcoin bulls were able to turn the tide at $24,900, the price has risen by more than 25%. Since then, however, BTC has been trading in the range between $29.800 and $31.300. Neither bulls nor bears have been able to gain the upper hand and break out of the trading range in higher time frames.

The renowned crypto trader and analyst “Rekt Capital” believes that all it takes is a positive catalyst to current BTC price action. According to him, Bitcoin’s current sideways trend within a tight range is a mere step away from its ultimate demise. He affirms that “a BTC downtrend is only ever one positive catalyst away from ending. And a BTC uptrend is always one negative catalyst from ending”, adding:
BTC has performed a bullish Monthly close but is primed for a healthy technical retest at ~$29250. With price currently around $30200… I wonder what negative catalyst will soon emerge to facilitate this technical retest.
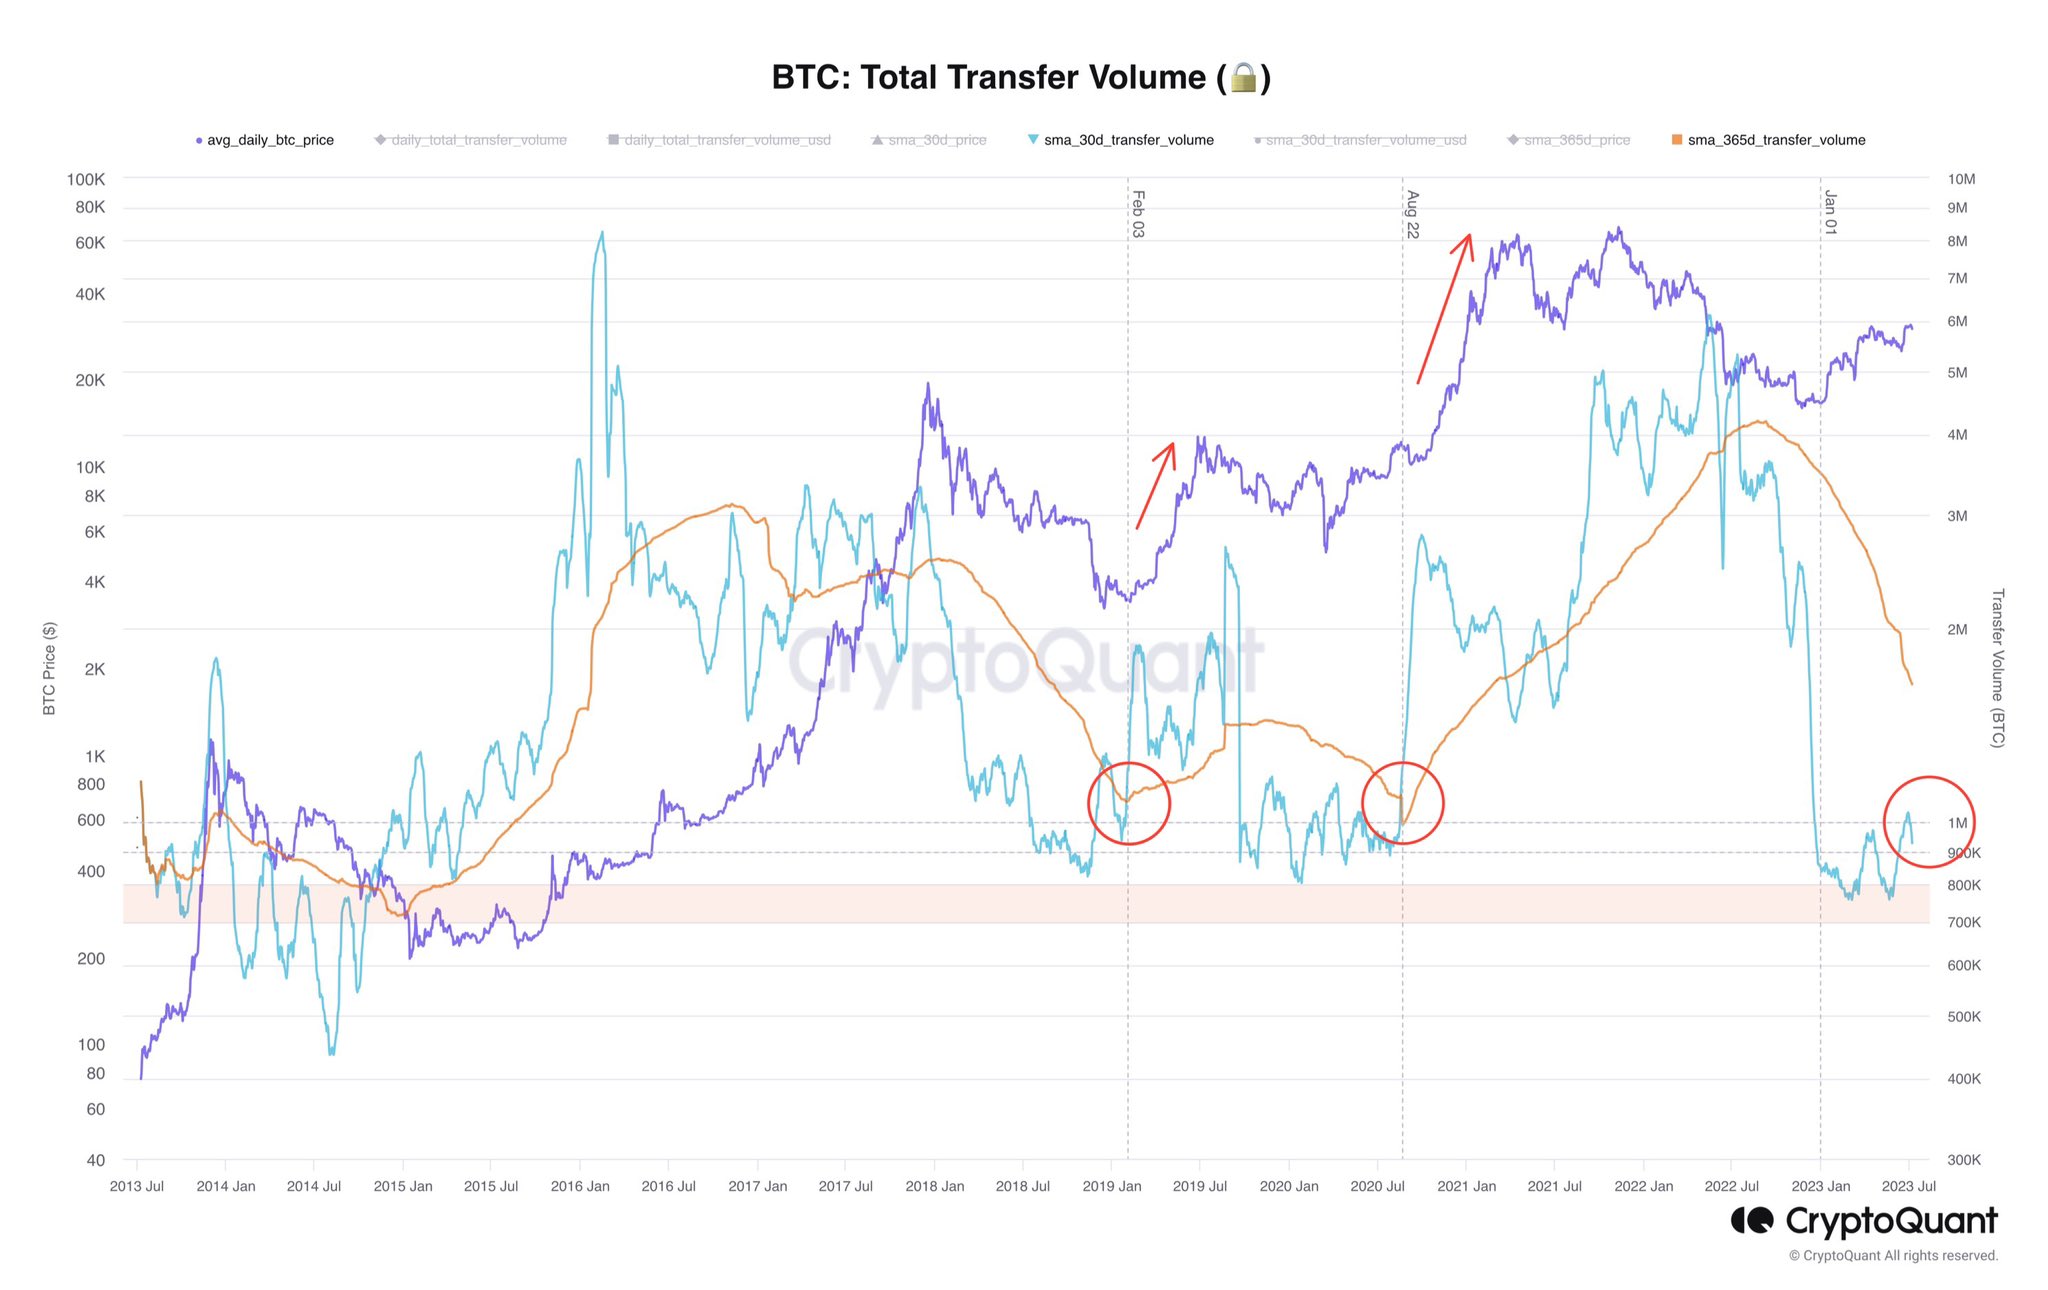
On-chain analyst Axel Adler Jr echoes this view and points to BTC total transfer volume as indicator for a massive breakout move. While the exact timing remains elusive, Adler Jr suggests that the moonshot could be triggered by a significant event such as the approval of a Bitcoin Exchange-Traded Fund (ETF).
Drawing from historical evidence, Adler Jr highlights the correlation between explosive price pumps and a surge in BTC’s total transfer volume. Past instances, like the dramatic surges witnessed in February 2019 and August 2020, lend weight to the argument that a similar surge may loom just around the corner.

Bulls Vs. Bears And Whale Games
Daan Crypto Trades remarks on the current state of the market, “They call this candlestick pattern: Thanks for your stops.” Daan’s keen eye eagerly awaits a decisive breakthrough that will propel Bitcoin into a significant move.
As the battle between bulls and bears ensues, he perceives the ongoing range-bound activity as a prelude to an imminent explosion. “Until then it’s just a lot of chop, stop hunts and liquidity grabs until one side comes out victorious.” Once the shackles of this consolidation are shattered, Daan predicts that the resulting breakout will mark the top for 2023:
If BTC were to grind back to the highs from here, I’d be pretty confident that the next breakout will be the one where we finally break out of this area. I also think this would be the sharpest move and likely sets the top for 2023 followed by a slow rest of the year. […]I would assume we’d visit approximately 36-40K in a quick fashion.
Meanwhile, renowned analyst Skew shed light on the intricacies of Bitcoin’s market dynamics. With an eagle eye on the Binance Spot market, Skew discerns substantial BTC accumulation occurring. He revealed that the supply is concentrated between $31.3K and $32K, while demand persists between $29.5K and $28K.
Unveiling the tactics of bigger players, Skew pointed to how whales employ aggressive short positions to manipulate the price within the narrow hourly range, exploiting bid liquidity and supply.
BTC Perp CVD Buckets & Delta Orders – This one really shows how rekt apes got earlier today (Long/Short CVD). Whales playing the 1-hour range between good bid liquidity & supply. TWAP orders / CVD shows aggressive shorts walking price back down from $31.4K to $30K.
Featured image from iStock, chart from TradingView.com
