On-chain data shows Ethereum whales have added $1 billion more to their holdings recently, something that could be bullish for the crypto’s price.
Ethereum Whales Now Hold 947,940 ETH More In Their Wallets
As per data from the analytics firm Santiment, this jump in the whale holdings is the 5th largest in this year so far.
The relevant indicator here is the “Supply Distribution,” which tells us the percentage of the total Ethereum supply that each wallet group has right now.
Wallets are divided into these groups based on the number of coins they are currently holding. For example, the 1-10 coins group includes all wallets that are storing amounts in this range at the moment.
The Supply Distribution metric for this cohort then measures what percentage of the total supply is made up by the sum of coins in these wallets specifically.
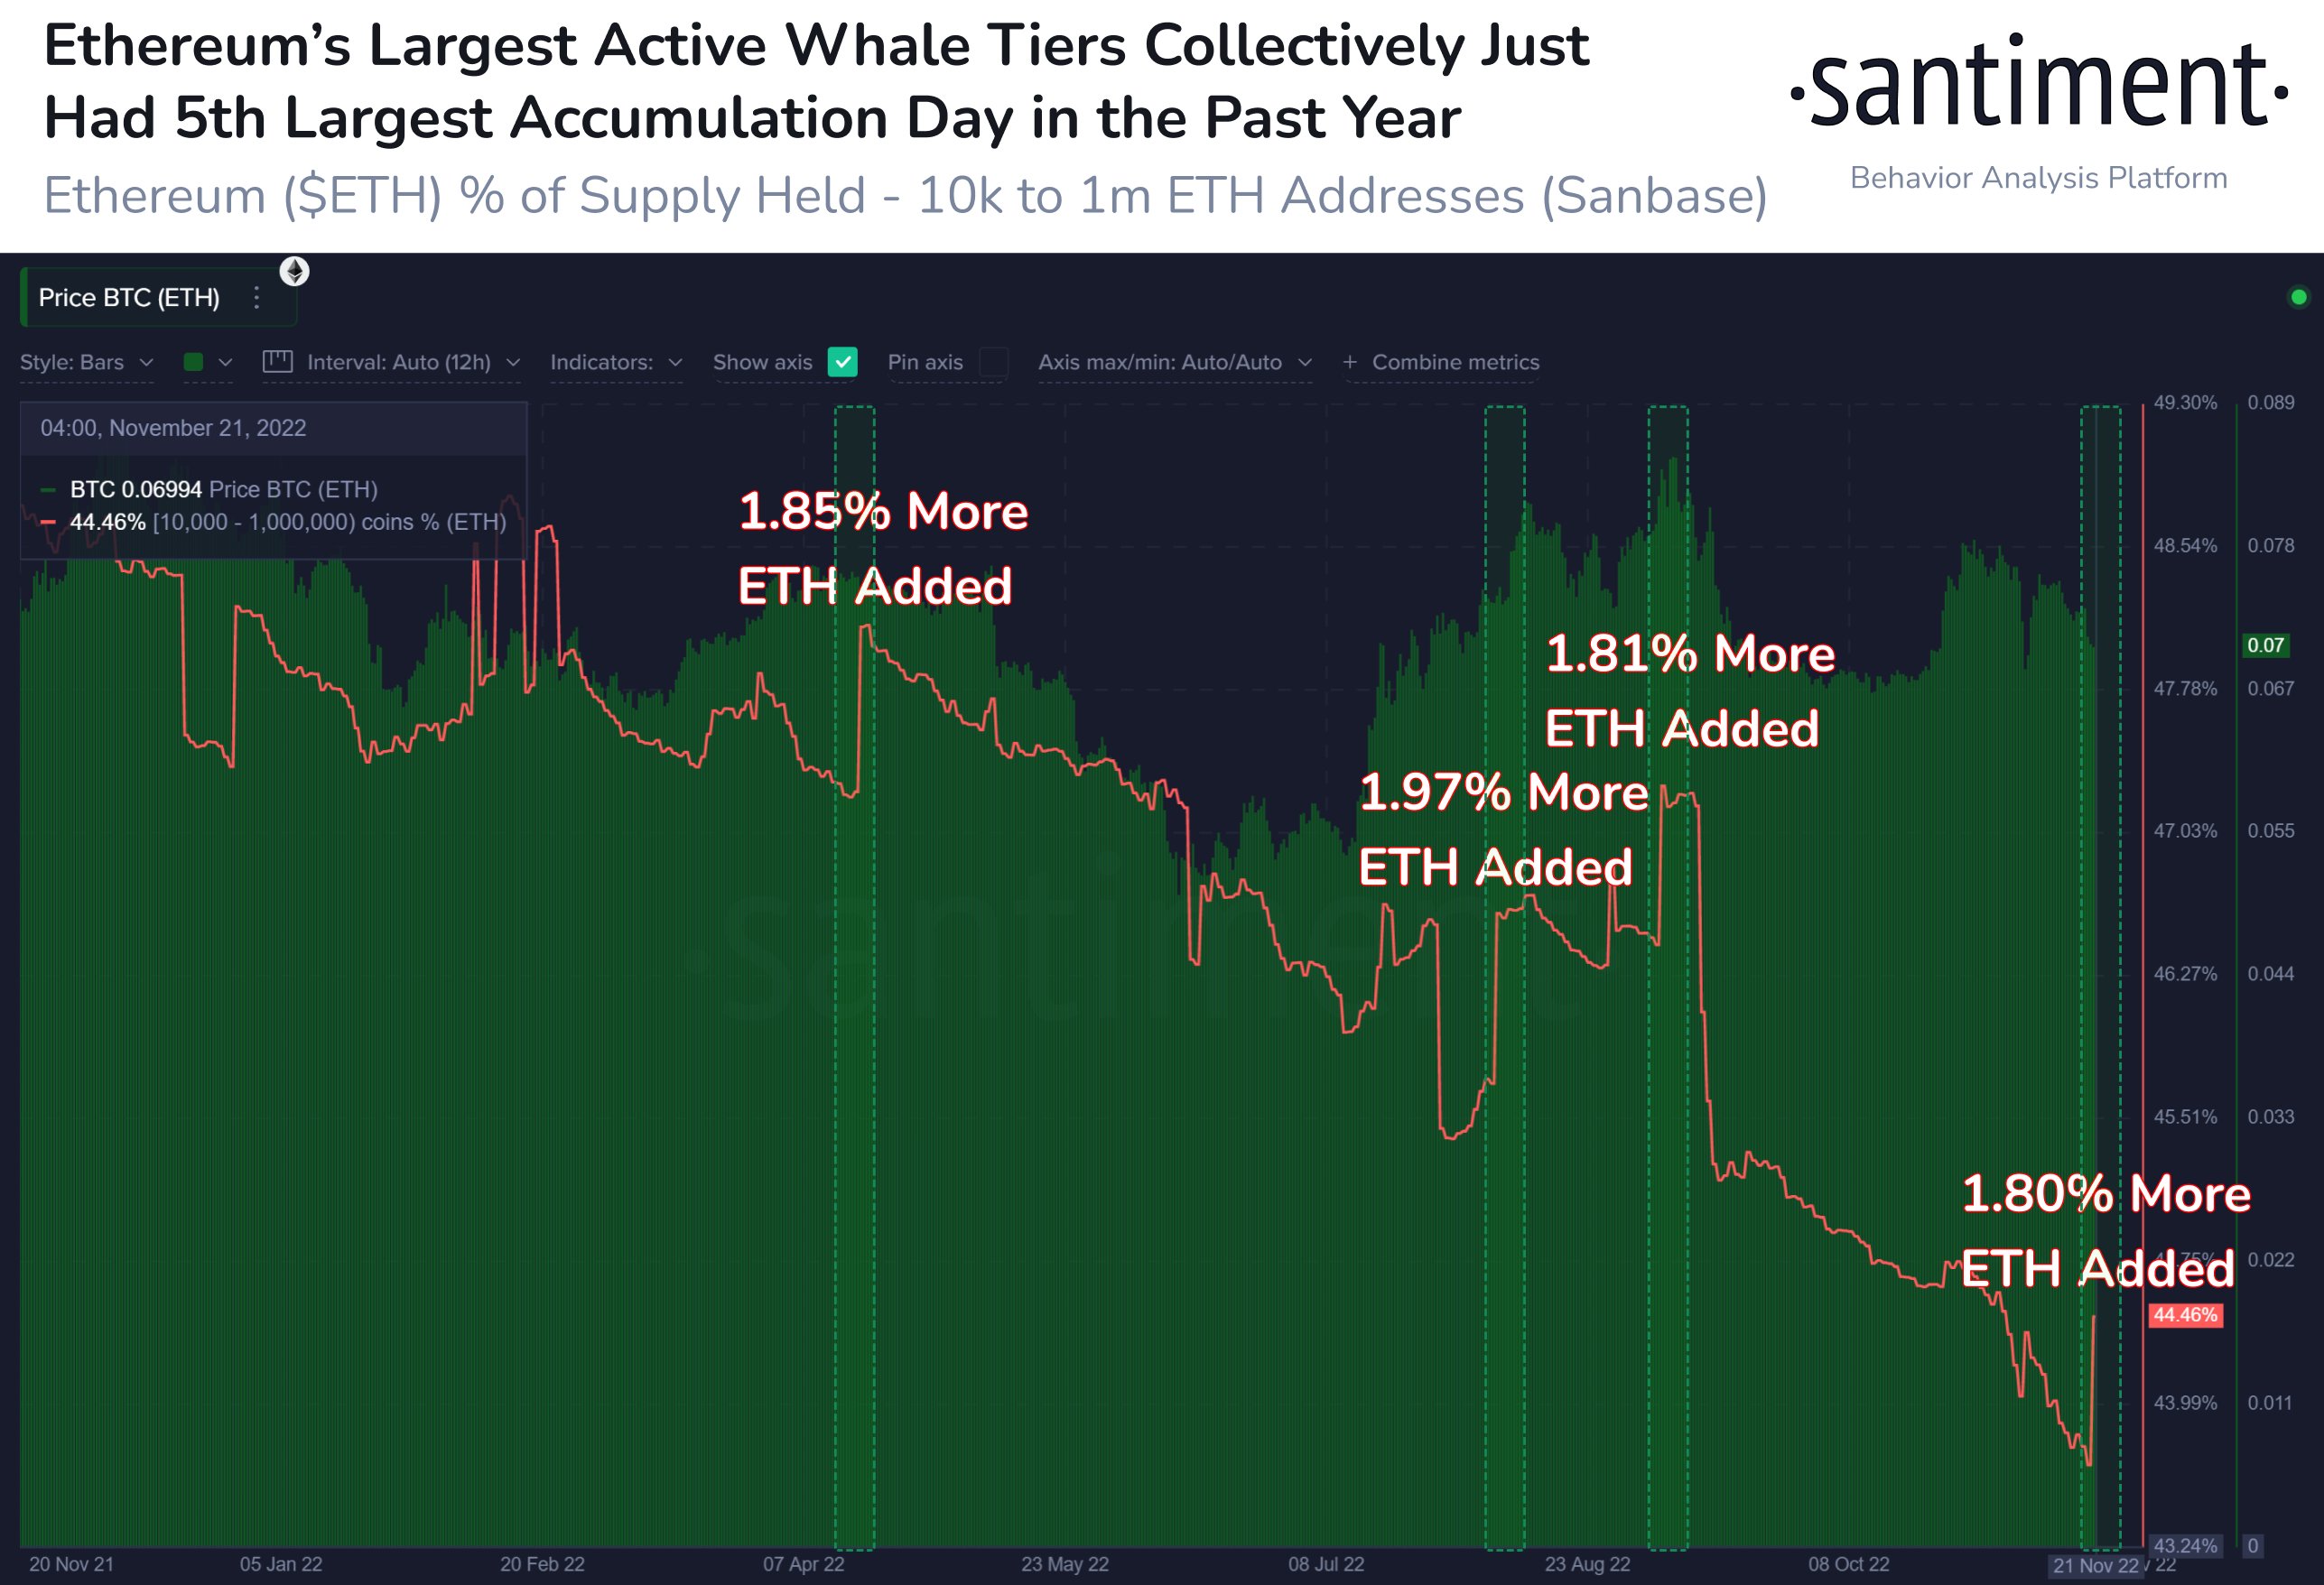
Now, here is a chart that shows the trend in this Ethereum indicator for the 10k-1m coins group over the last twelve months:
Looks like the value of the metric has sharply gone up in recent days | Source: Santiment
The significance of the 10k-1m coins group is that it represents the wallets owned by large Ethereum whales. In the USD, this range corresponds to holdings worth between $10.9 million and $1 billion.
As you can see in the above graph, the Supply Distribution value for this ETH wallet group has shot up recently.
This latest spike amounts to an increase of 1.8%, which means these whales have added almost 1 million ETH more to their holdings now. At the current exchange rate, this amount converts to more than $1.1 billion.
In the past year, there have only been four instances where this Ethereum indicator has seen a larger single day increase.
Interestingly, during these past few occurrences where whales added similar amounts to their holdings, ETH vs BTC price chart grew by an average of 3.2% in the days following the pattern formation.
Related Reading: Latest Findings Show Bitcoin Holders Under Fire As Price Continues To Sink
If a similar trend follows this time as well, then the current accumulation from whales may also have a bullish impact on the price of Ethereum in the coming days.
ETH Price
At the time of writing, Ethereum’s price floats around $1.1k, down 4% in the last week. Over the past month, the crypto has lost 13% in value.
Below is a chart that shows the trend in the price of the coin over the last five days.

The value of the crypto seems to have plunged down during the last couple of days or so | Source: ETHUSD on TradingView
Featured image from Abigail Lynn on Unsplash.com, charts from TradingView.com, Santiment.net

