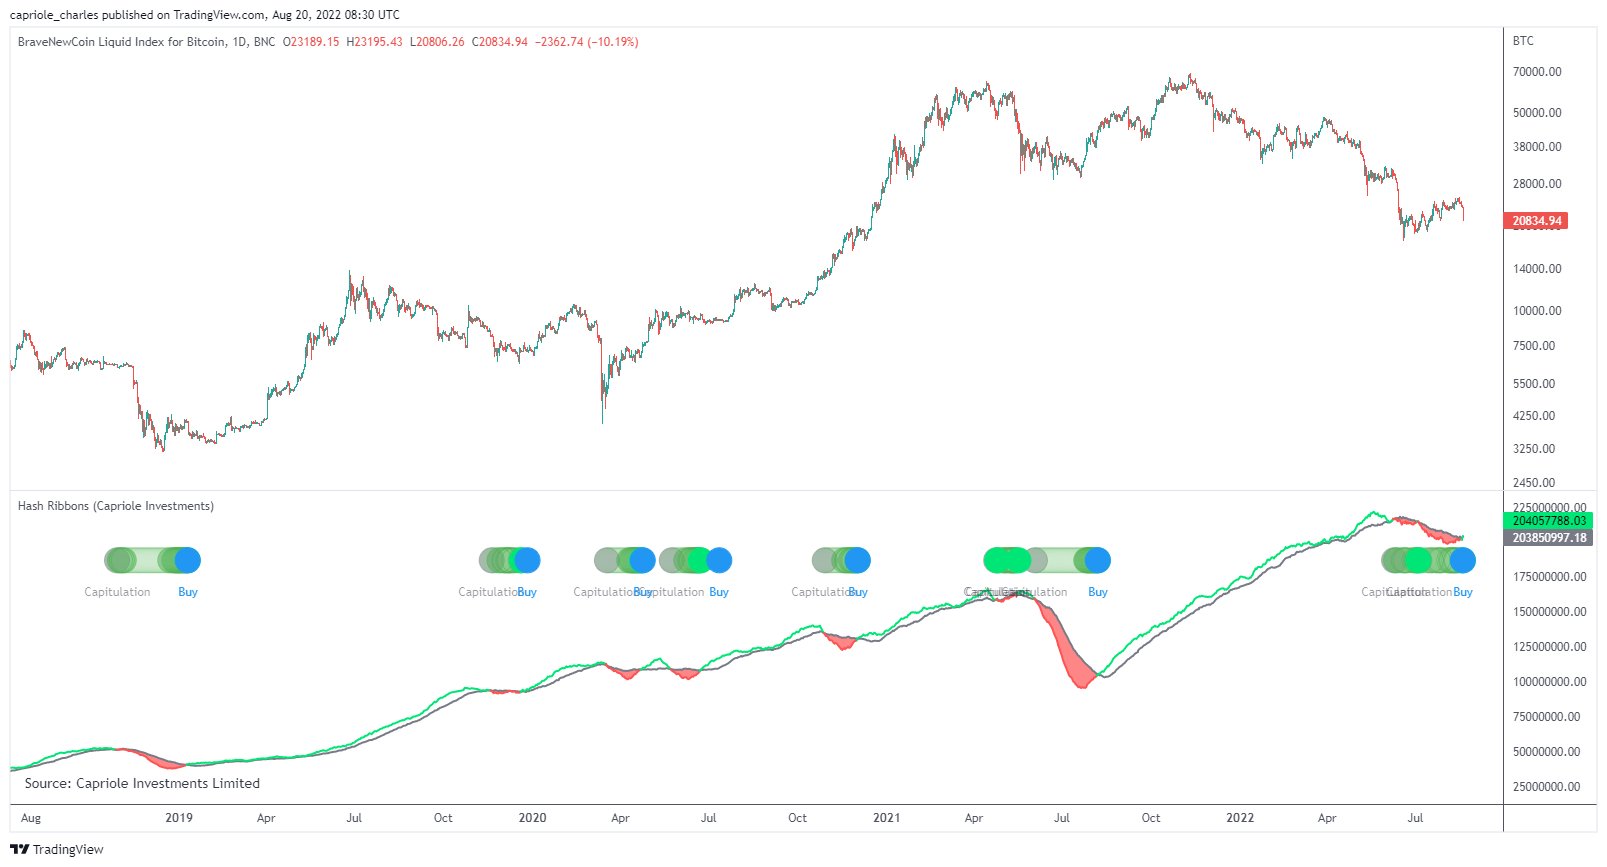
The latest trend in the Bitcoin “hash ribbon” indicator has just formed a pattern that has historically been a buy signal for the crypto.
Bitcoin Hash Ribbon Buy Signal Goes Off As Miner Capitulation Comes To An End
As explained by an analyst on Twitter, the BTC miner capitulation phase seems to have ended today after going on for 71 days.
Before trying to understand what the “hash ribbon” indicator does, it’s best to first take a look at the “hashrate” metric.
The hashrate is a measure of the total amount of computing power connected to the Bitcoin blockchain by the miners. During bear markets, some miners’ income drops so low that running their operations becomes unprofitable for them. In such times, their only choice is to plug off their machines, which registers as a downtrend in the hashrate.
In past bear markets, the major bottoms have generally taken place during these periods of miner capitulations, where a large number of miners rapidly go offline due to low revenues.
An indicator to pinpoint these miner capitulation periods is the hash ribbons. Devised by the aforementioned analyst, Charles Edwards, this metric uses two different moving averages of the hashrate, the 30-day MA and the 60-day MA, to note for changes in miner behavior.
Here is a chart that shows the trend in the Bitcoin hash ribbons over the last few years:
The 30-day SMA hashrate seems to have just passed above the 60-day SMA version | Source: Charles Edwards on Twitter
As you can see in the above graph, the Bitcoin miner capitulation periods are marked using the hash ribbons indicator.
Whenever the 30-day MA version of the hashrate declines under the 60-day MA line, the miners are assumed to be beginning a capitulation phase.
A break above the 60-day MA by the 30-day MA, on the other hand, implies an end to capitulation by these chain validators.
When this kind of capitulation ending crossover of the hash ribbons occurs, a buy signal goes off for the crypto.
But even among these buy signals, there are some that are especially profitable. Such signals form following miner capitulations that happen more than 2 years after any halving event.
Today, the hash ribbons have once again painted the historic pattern of the buy signal as the latest run of miner capitulation has come to an end after 71 days. It has also now been more than 2 years since the last halving event, which, going by the past trend, would suggest this is one of those rare “most profitable” buy signals for Bitcoin.
BTC Price
At the time of writing, Bitcoin’s price floats around $21.3k, down 13% in the past week.

Looks like the value of BTC has plunged down | Source: BTCUSD on TradingView
Featured image from Unsplash.com, charts from TradingView.com

