Bitcoin’s hash rate represents the total computational power employed to mine and validate transactions on the network. Beyond merely representing the sheer computing prowess, the hash rate serves as a barometer for the network’s security and vitality.
A robust hash rate indicates not only a high participation of miners but also underscores the network’s resilience against potential attacks. Monitoring this metric is crucial, as fluctuations can offer insights into miner sentiment, potential network vulnerabilities, and the overall health and decentralization of the Bitcoin ecosystem. In essence, the hash rate is a multifaceted indicator, reflecting both the technical strength and the collective confidence in the Bitcoin network.
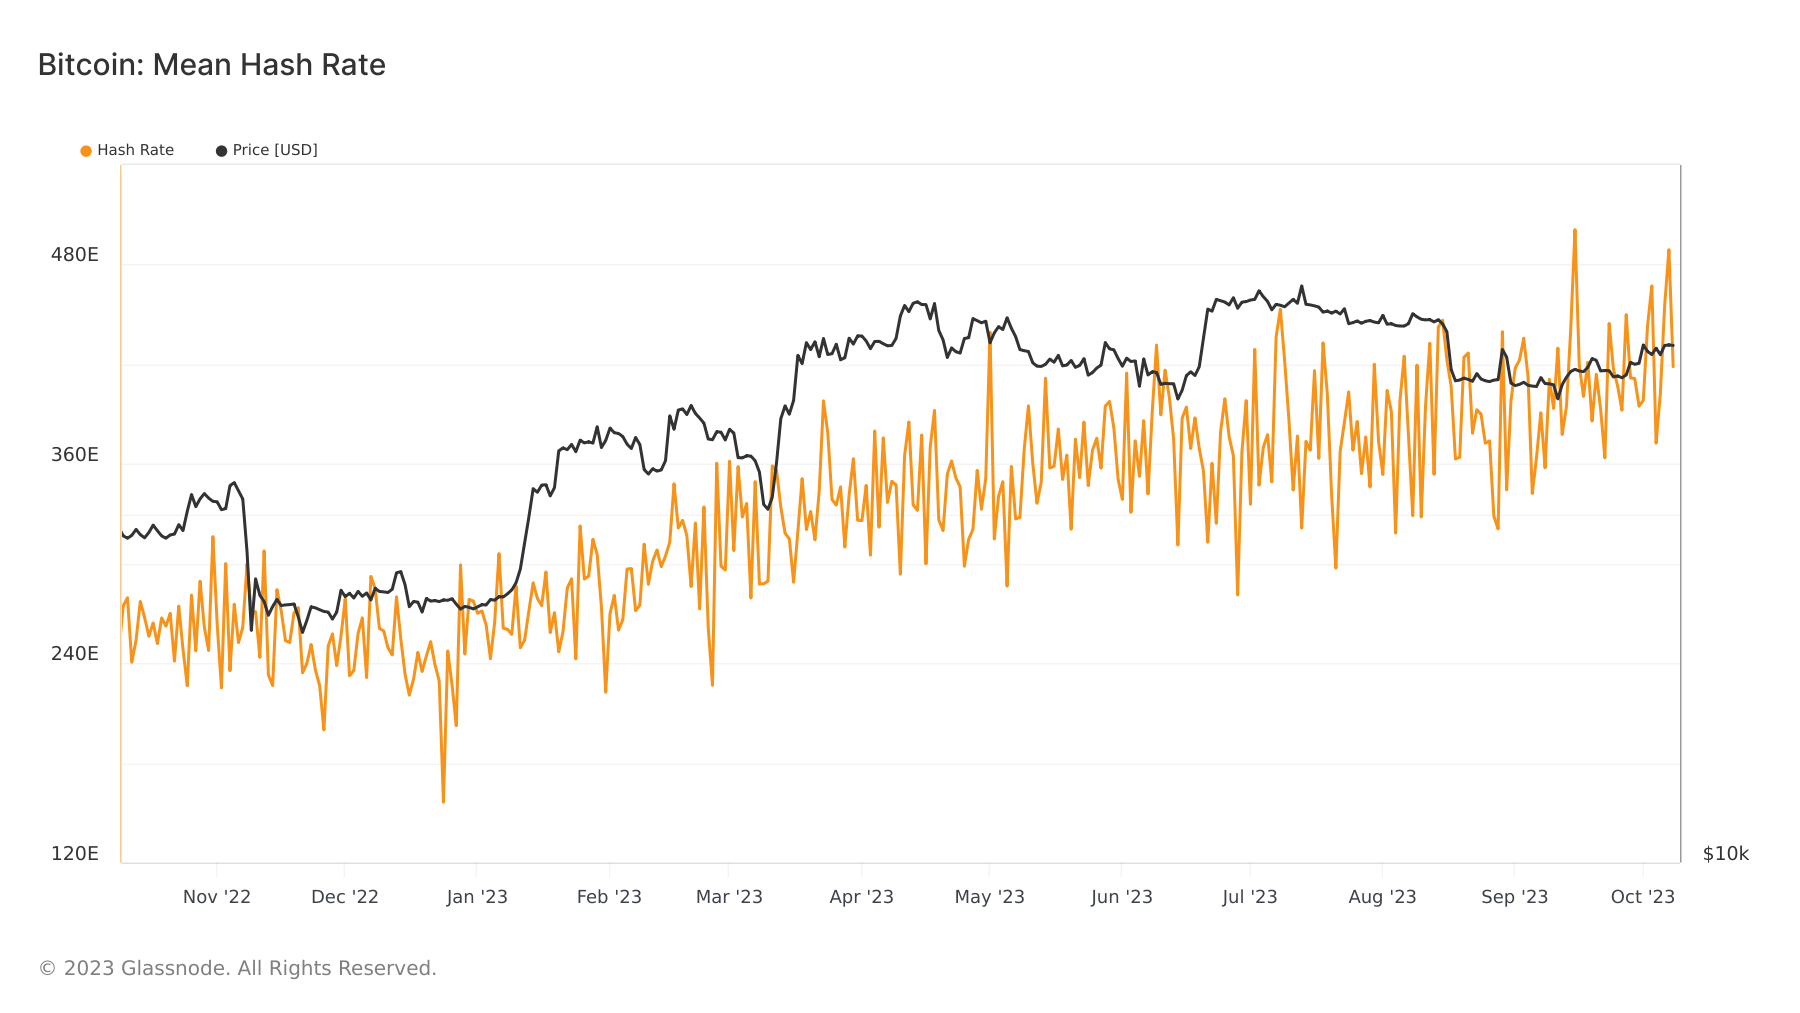
Bitcoin’s hash rate has been posting new all-time highs every week since December 2022, peaking at 501 EH/s on Sep. 15. As of Oct. 8, the hash rate stands at 418 EH/s.

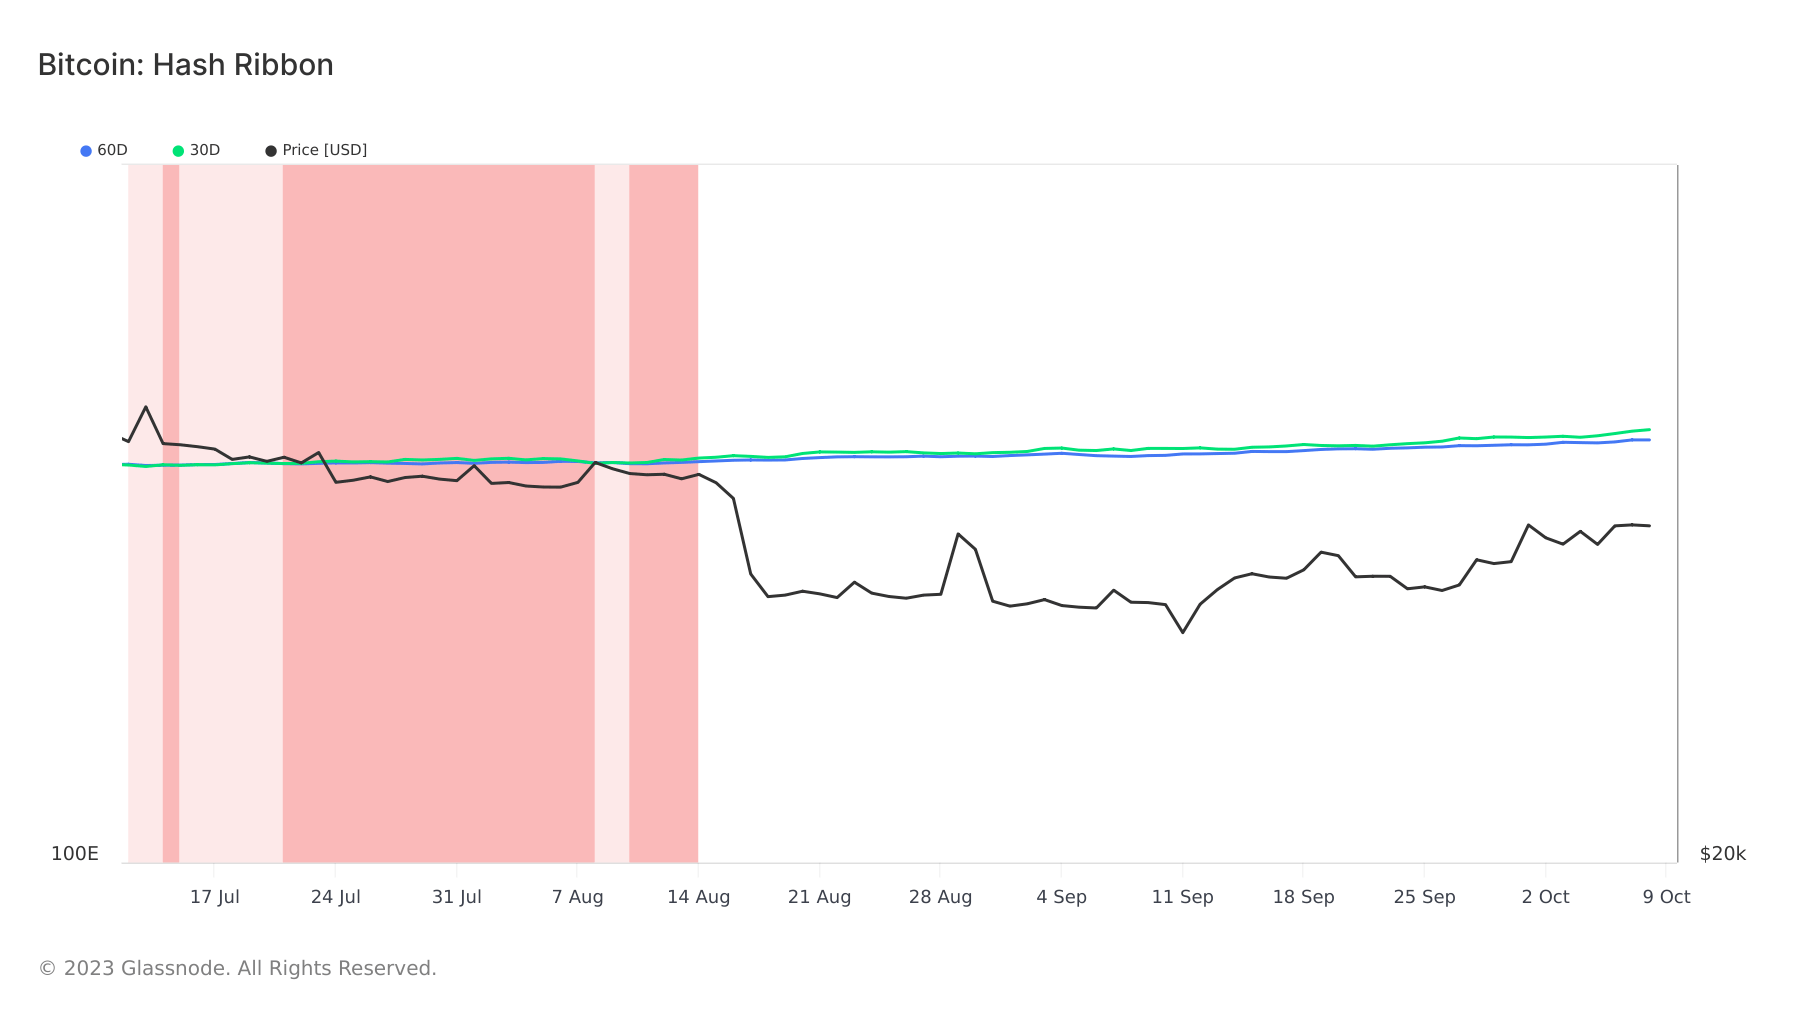
However, merely looking at the hash rate fails to provide more context to market sentiment. To get a better understanding of miner health, we must analyze the convergence and divergence of the moving averages of the hash rate. Monitoring this metric is crucial, as fluctuations can offer insights into miner sentiment, potential network vulnerabilities, and the overall health and decentralization of the Bitcoin ecosystem. Hash ribbons are a multifaceted indicator, reflecting both the technical strength and the collective confidence in the Bitcoin network.
Since mid-August, the 30-day MA of Bitcoin’s hash rate has consistently outpaced the 60-day MA. Notably, the ribbons underwent compression in July and August, a phenomenon historically indicative of miner capitulation. However, the divergence between these two moving averages has been widening since the start of October 2023, coinciding with Bitcoin’s ascent to $28,000. This divergence suggests that miners are bullish, ramping up their operations in anticipation of higher prices.

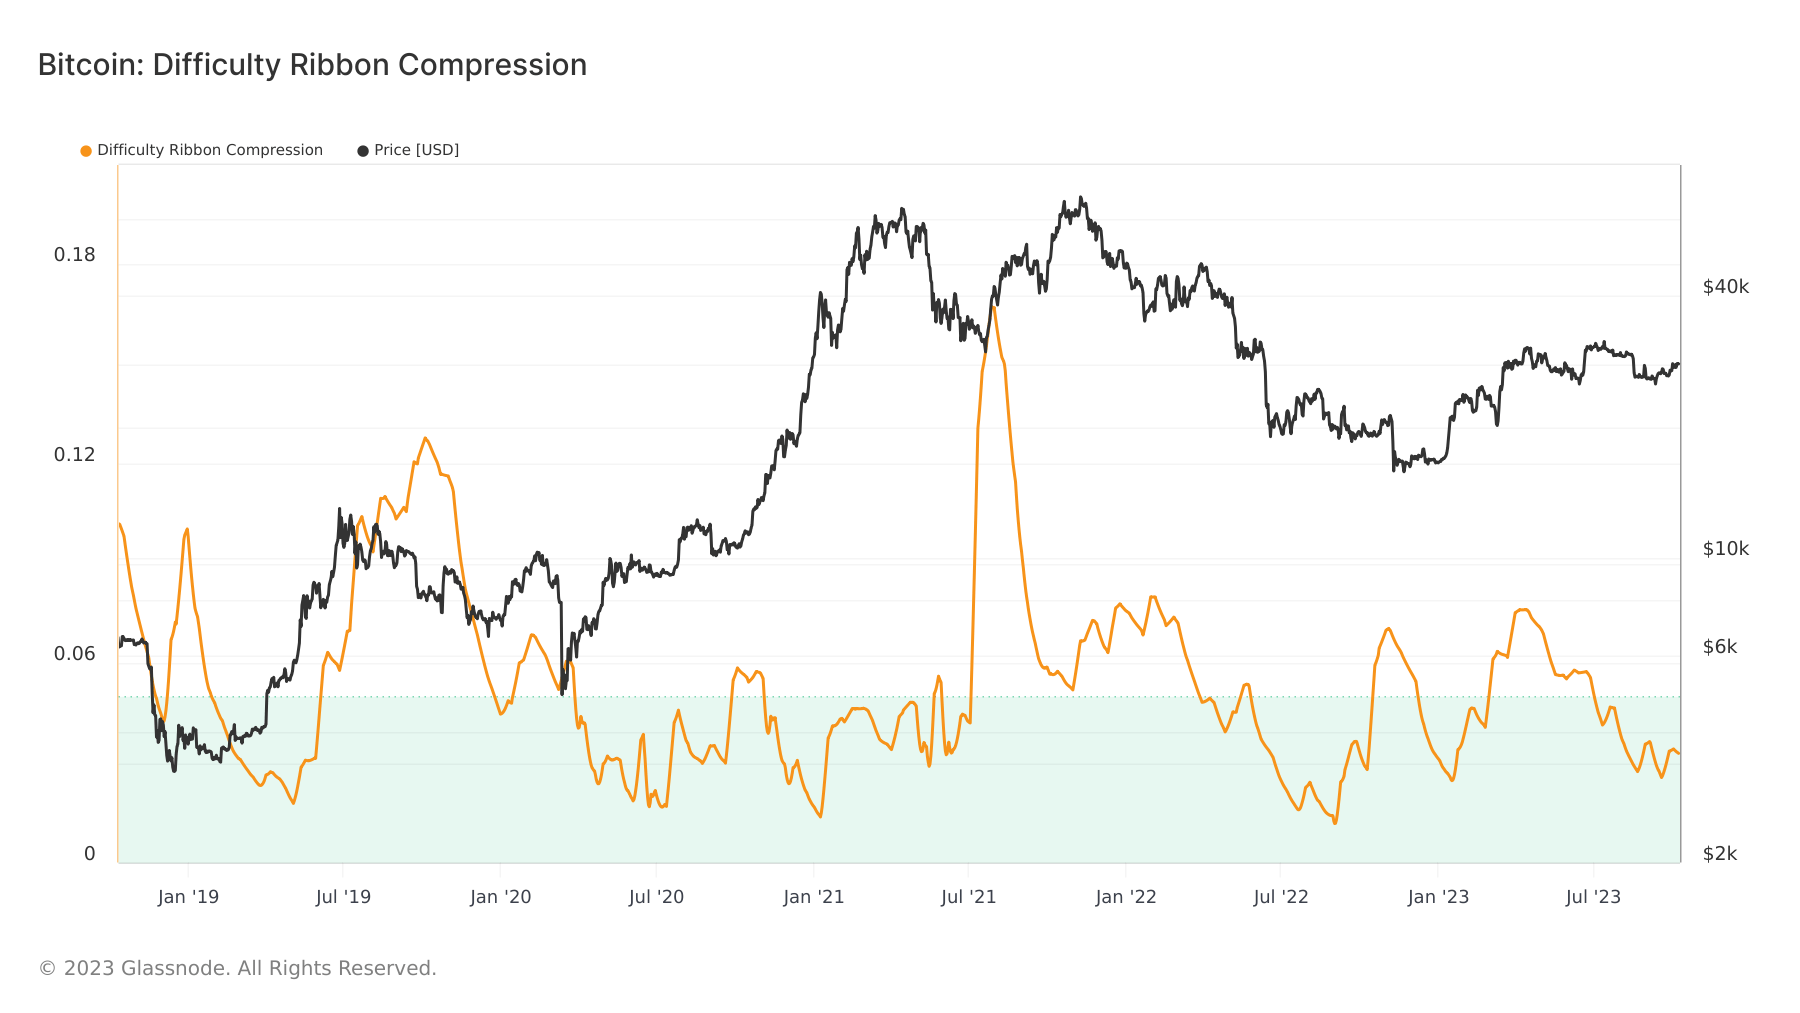
Mining difficulty, another cornerstone metric, adjusts approximately every two weeks to ensure that blocks are added to the blockchain at a consistent interval. The Difficulty Ribbon Compression metric provides insights into miner selling pressure. Historically, high compression zones, marked by low values in this metric, have signaled lucrative buying opportunities for Bitcoin. Conversely, spikes in this metric have often been in tandem with Bitcoin’s price surges. As of June 30, the difficulty ribbon compression was below the 0.05 threshold, and as of October 8, it stood at 0.032, suggesting potential upward price momentum.

The rising hash rate underscores a robust and secure network, while the hash ribbons and difficulty ribbon compression hint at bullish miner sentiment and potential price appreciation.
The post Mining metrics suggest bullish sentiment for Bitcoin appeared first on CryptoSlate.
