Ethereum prices are firm at spot rates, still trading above the $2,000 level, and multiple other factors point to possible trend continuation.
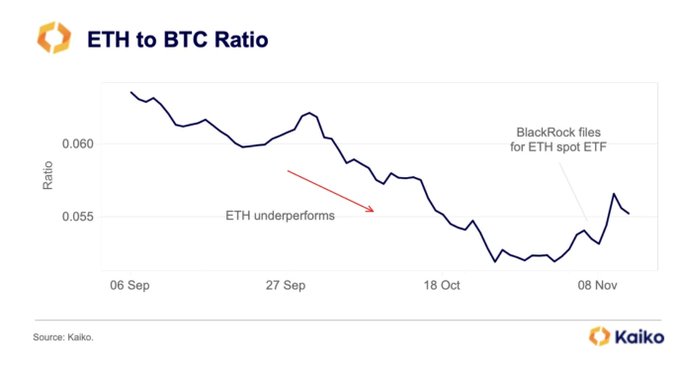
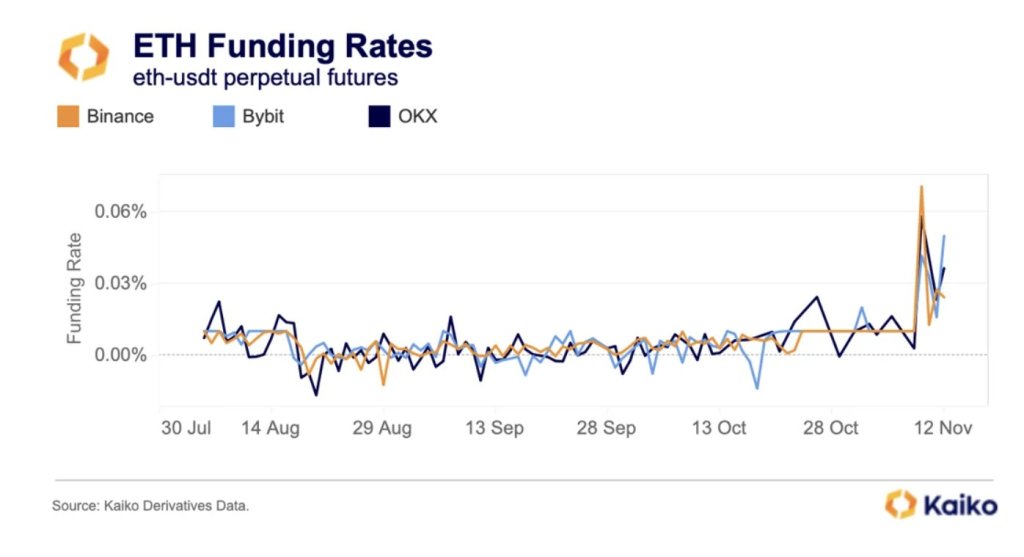
According to Kaiko’s data on November 12, not only is the ETH-BTC ratio shifting and reversing after extended periods of lower lows, but also there is a notable uptick in trading volume with funding rates in crypto derivative platforms shifting from negative to positive, suggesting increasing demand.

Ethereum Breakout Above $2,000
As of writing on November 13, Ethereum is relatively firm and changing hands at around the $2,090 level. Despite the expected contraction in trading volume over the past couple of days following the rally on November 9, the uptrend remains in place.
So far, the immediate support level technical analysts are watching remain at $2,000, marking July 2023 highs. Conversely, the $2,100 zone, marking the April high, is a critical liquidation level that optimistic bulls must break for a buy trend continuation pattern.
As it is, traders are optimistic. However, whether the uptrend will continue depends primarily on trader sentiment and if existing fundamental factors might spark more demand, lifting ETH to new 2023 highs. Thus far, even though the general ETH support base remains upbeat, the coin, unlike Bitcoin (BTC), is struggling to break key resistance levels recorded in H1 2023, which is a concern.
ETHBTC Turning Bullish As Funding Rate Flips Positive
On the positive side, looking at the ETHBTC candlestick arrangement in the daily chart, the sharp reversal of ETH fortunes on November 9 could anchor the next leg up, signaling a new shift in a trend that favors Ethereum buyers. Looking at the ETHBTC formation, Bitcoin bulls have had the upper hand in 2023.
Related Reading: XRP Price Path To $1: Exploring Two Potential Outcomes From The $0.66 Resistance Level
To quantify, BTC is up 33% versus ETH, with the climactic sell-off of October 23 pushing BTC to the highest point against the second most valuable coin in 2023. However, the sharp recovery on November 9 and the subsequent failure of BTC bulls to reverse losses suggest that ETH has the upper hand.
Thus far, ETHBTC prices are trending inside the November 9 bullish engulfing bar at the back of light trading volumes, a net positive for bullish ETH holders.

Following this surge, Kaiko notes that the funding rate of the ETHUSDT pair is positive, signaling increasing demand in the crypto derivatives scene. When funding rates turn positive from negative, it means “long” traders are paying “short” traders to keep their positions open. This development indicates that more traders are long ETH, expecting prices to rise in the sessions ahead.
Feature image from Canva, chart from TradingView
