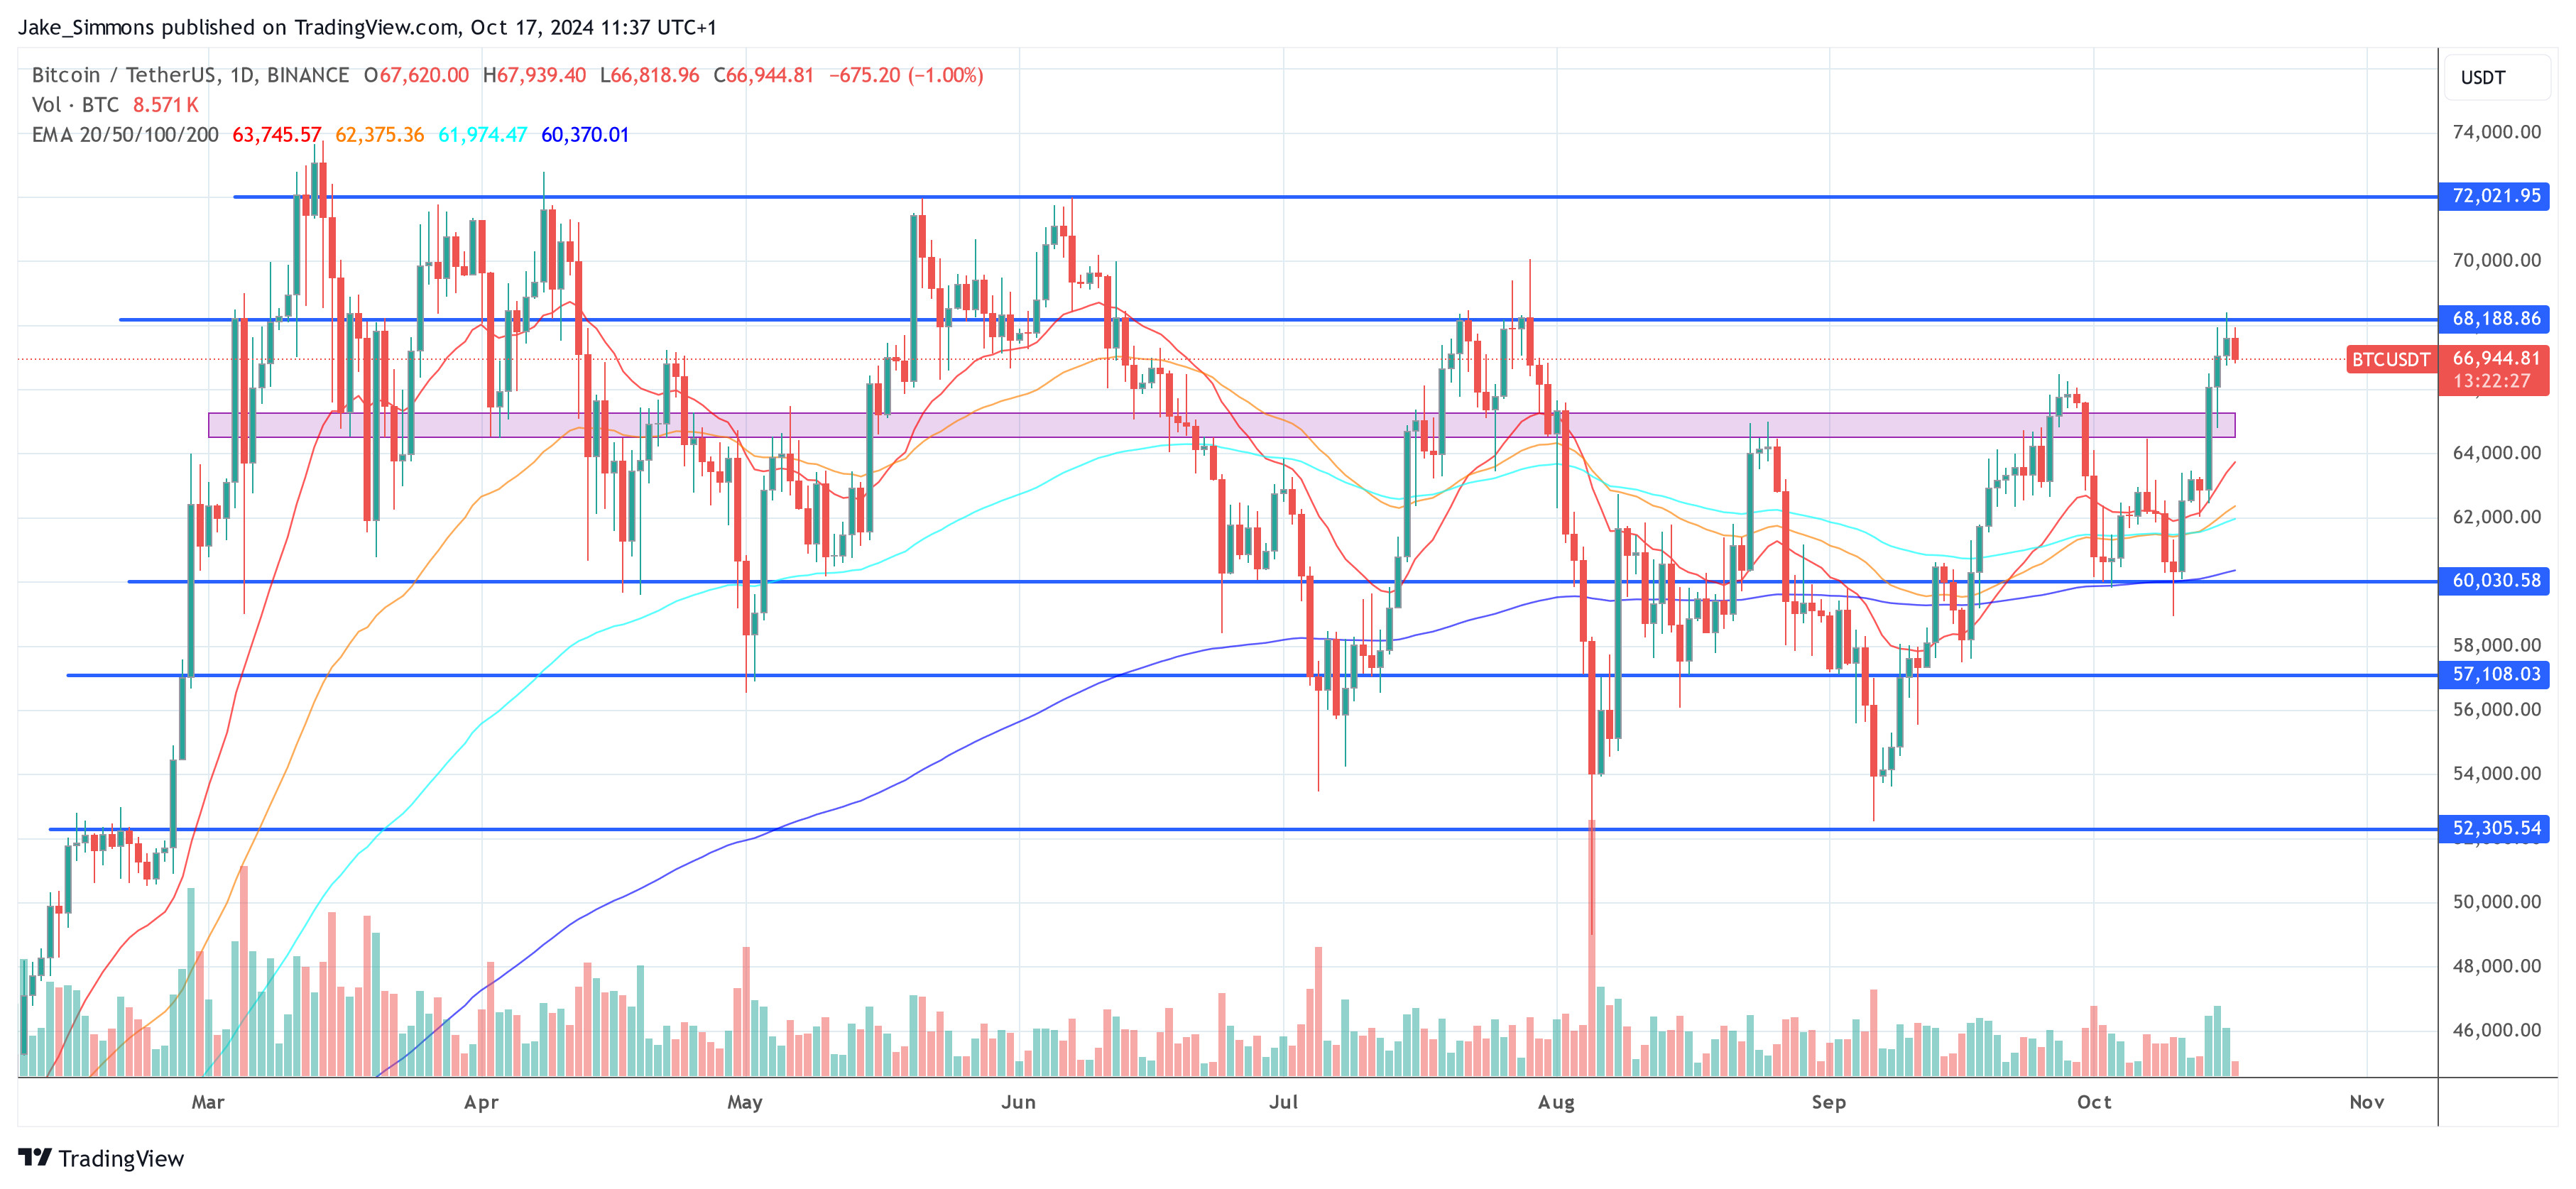
As Bitcoin (BTC) edges closer to the $70,000 mark, the crypto community is abuzz with predictions of a potential surge to $100,000, accompanied by a significant altcoin season. Amidst this fervor, crypto analyst Axel Bitblaze has provided an analysis on X, examining whether the necessary liquidity and catalysts are in place to propel Bitcoin to such heights.
Bitblaze emphasizes the fundamental role of liquidity in the crypto market. Drawing parallels to previous bull runs, he notes, “Our space is fully driven by just one thing, i.e., Liquidity.” He references the 2016 and 2020 bull markets, both of which were significantly fueled by increasing liquidity. This time, the question is whether similar or greater liquidity events are on the horizon to drive Bitcoin’s price higher.
#1 Bitcoin Surge Set To Be Fueled By Stablecoins
A cornerstone of Bitblaze’s analysis is the current state of the stablecoins market. He describes stablecoins as “the gateway to the crypto industry,” underscoring their indispensability to the crypto ecosystem. The total market capitalization of stablecoins has surged to $173 billion, reaching its highest level since the collapse of TerraUSD (UST).
Related Reading
Tether (USDT) remains the dominant player, comprising 69% of the total stablecoin market cap with $120 billion. Bitblaze highlights the historical correlation between BTC prices and USDT’s market capitalization, stating, “Between March 2020 to November 2021, USDT MCap rose by 17x while BTC price pumped by 16.5x.”
However, since March 2024, despite USDT’s market cap continuing to rise, Bitcoin’s price has remained relatively stagnant. “This indicates there’s a lot of liquidity waiting on the sidelines to enter BTC and crypto. I guess they’ll start deploying soon, right?” the analyst states.
#2 FASB Rule Change
Another significant factor is the impending change in accounting standards by the Financial Accounting Standards Board (FASB). Currently, publicly listed companies face challenges in holding Bitcoin due to unfavorable accounting treatments.
Bitblaze explains, “Let’s say a company bought 100 BTC at $67,000 each. If BTC drops to $60,000 and then pumps to $68,000, the company still needs to report it at $60,000… they will have to show it as a loss even though it’s in profit.” This results in misleading earnings reports and adversely affects share prices, discouraging companies from investing in Bitcoin despite its potential as an asset.
The upcoming FASB rule change, set to be implemented in December 2024, is poised to address this issue. Under the new guidelines, companies will be able to report the fair value of their Bitcoin holdings based on market prices at the end of the reporting period. Bitblaze suggests that this regulatory shift could incentivize more corporations to adopt Bitcoin as part of their balance sheets.
Related Reading
He cites MicroStrategy as a precedent, noting that since August 2020, the company has accumulated 252,220 BTC worth $17.4 billion, currently realizing a profit of $7.4 billion. With S&P 500 companies collectively holding approximately $2.5 trillion in cash and cash equivalents—assets vulnerable to inflation—Bitcoin presents itself as an attractive, inflation-resistant alternative.
#3 Expanding M2 Money Supply
Bitblaze also delves into the macroeconomic landscape, particularly the M2 money supply, which includes cash, checking deposits, and other easily convertible near money. Currently, the M2 money supply stands at $94 trillion, nearly 39 times the total crypto market capitalization.
Bitblaze references an analysis indicating that “for every 10% increase in M2 money supply, BTC pumps 90%.” Despite the M2 money supply being approximately 3% higher than its previous peak, Bitcoin has yet to surpass its 2021 highs, suggesting that ample liquidity remains untapped.
“Currently, M2 money supply is almost 3% higher than its last peak, while BTC is still below its 2021 high. With Global rate cuts happening along with QE, fiat will become a worse investment. As Ray Dalio said, #Cash is Trash,# and now this gigantic money supply will find a way into different asset classes, including crypto; the analyst claims.
#4 Shift From Money Market Funds To Bitcoin
Since November 2021, money market funds have grown to $6.5 trillion as investors sought the safety of Treasury bills amid rising interest rates. However, with the Federal Reserve initiating rate cuts and signaling more to come, the yields on T-bills are expected to diminish, likely causing a significant outflow from money market funds.
Bitblaze predicts, “This’ll cause a massive outflow from money market funds as the T-bills yield will diminish,” suggesting that investors will seek higher returns in riskier assets such as Bitcoin and other cryptocurrencies. He refers to these digital assets as “the fastest horses” in a QE environment, forecasting that this shift could channel substantial capital into the crypto markets.
To quantify the potential inflow, Bitblaze aggregates the available liquidity sources: the M2 money supply of $94 trillion, money market funds totaling $6.5 trillion, cash holdings of S&P 500 companies amounting to $2.5 trillion, and the stablecoins market cap of $173 billion. This brings the total to approximately $103.17 trillion, which is 43 times the current total crypto market capitalization.
He further addresses skeptics, concluded: “For a $200 Billion inflow, only 0.19% of this account needed to enter crypto. For those who think this isn’t possible and 200B is too much, BTC ETFs had over $20B in net inflows despite sideways price action, no rate cuts, and no QE.”
At press time, BTC traded at $66,944.

Featured image created with DALL.E, chart from TradingView.com
