On-chain data shows the Bitcoin Puell Multiple has hit pretty high levels recently. Here’s what this may mean for the current rally.
Bitcoin Puell Multiple Has Risen To High Levels In Recent Days
As pointed out by an analyst in a CryptoQuant post, the Puell Multiple is currently at even higher levels than those seen during the 2021 bull run top. The “Puell Multiple” is an indicator that measures the ratio between the daily revenue of the Bitcoin miners and the 365-day average value of the same.
The mining revenue here is calculated by multiplying the spot price by the total number of coins that the miners are issuing (that is, receiving their block rewards) every day.
This metric tries to judge whether the current price of the cryptocurrency is fair or not by comparing the current revenue of the miners against the yearly average.
When this metric has a value above 1, it means the miners are making higher revenues than the average for the past year right now. The asset’s value may be said to be overpriced during such times as the miners gain more motive to sell the more profits they are making.
On the other hand, values of the indicator below 1 imply these chain validators are making less than the norm currently. The lower the indicator’s value goes, the more trouble the miners may have in supporting their operations. Thus, the coin could be assumed to be undervalued during such conditions.
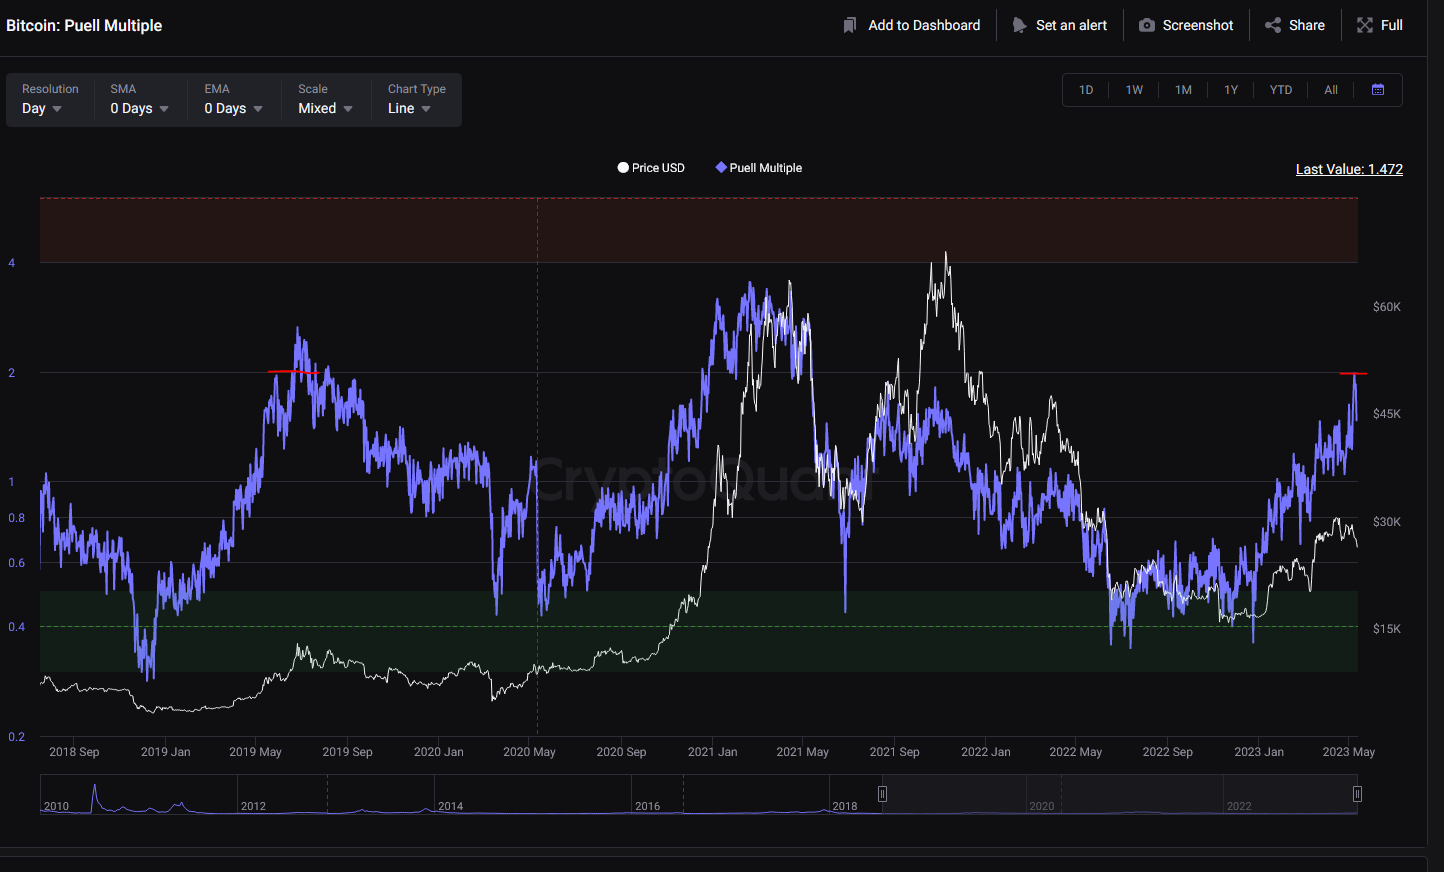
Now, here is a chart that shows the trend in the Bitcoin Puell Multiple over the last few years:

The value of the metric seems to have been quite high in recent days | Source: CryptoQuant
Historically, major bottoms in the cryptocurrency’s price have formed whenever the Puell Multiple has dipped below the 0.5 mark. Below this value, miners’ daily revenues are less than 50% of the yearly average, meaning that this cohort comes under some intense pressure inside this zone.
Tops, however, haven’t been so simple; the value at which they occur seems to have been decreasing with each Bitcoin bull run. But in general, they have naturally occurred at values significantly above the 1 mark (that is, during periods when the miners are raking in large amounts of revenues).
During the last couple of months, the Puell Multiple has once again been above the 1 level, and recently, it has observed a further surge towards a value of 2. This value is interestingly even higher than what was observed during the November 2021 all-time high price, but not near the levels of the first half of 2021 top.
The current levels of the metric are also only slightly lesser than what the April 2019 rally, a rally that bears many similarities with the current one, saw during its top.
Obviously, it’s hard to say anything about the top based on these observations alone, as tops have historically not followed any set pattern of the indicator, unlike the bottoms. However, the current values still likely imply that the price has become quite overheated recently, which may mean that even if a top isn’t in yet, it may be close nonetheless.
BTC Price
At the time of writing, Bitcoin is trading around $27,300, down 2% in the last week.
BTC has surged during the past day | Source: BTCUSD on TradingView
Featured image from iStock.com, charts from TradingView.com, CryptoQuant.com
