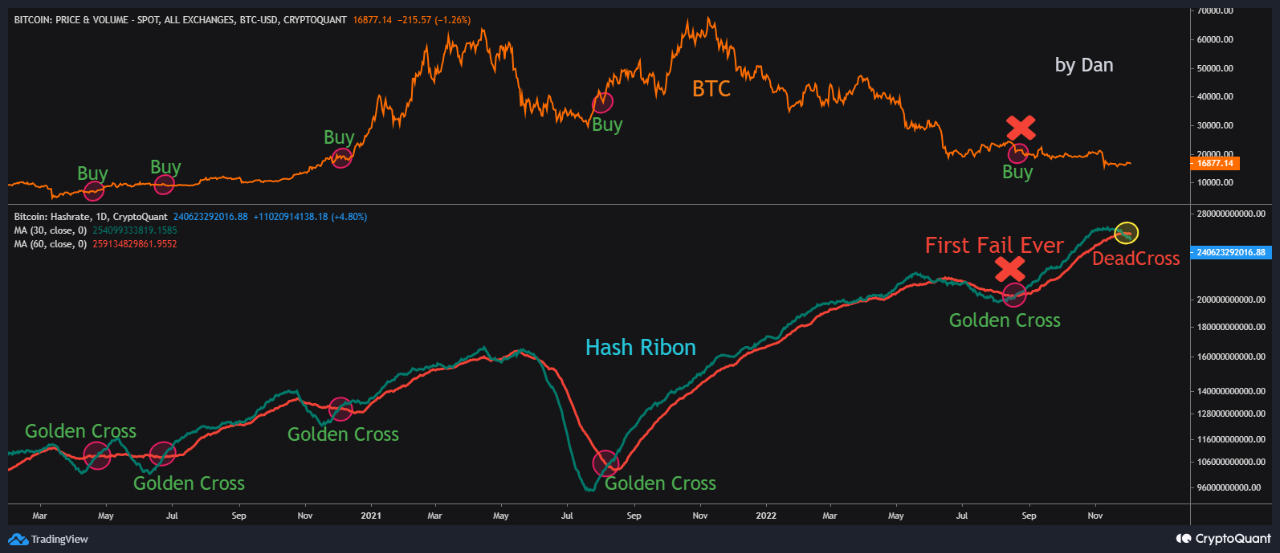
On-chain data shows the Bitcoin Hash Ribbon golden cross has failed to provide an uplift to the price for the first time ever.
Bitcoin Hash Ribbons Have Recently Formed A Death Cross
As pointed out by an analyst in a CryptoQuant post, the BTC Hash Ribbon model has failed for the first time in the crypto’s history.
The relevant indicator here is the “mining hashrate,” which measures the total amount of computing power connected to the Bitcoin network right now.
When the value of this metric trends up, it means miners are bringing more mining rigs online currently. On the other hand, a decline suggests these chain validators are ditching the network and disconnecting their machines.
The Hash Ribbon is a BTC model that’s based on two moving averages of the hashrate metric. A “moving average” (MA) is the mean value of any quantity that, as its name implies, keeps moving with the metric and changes its value accordingly.
The benefit of an MA is that it smooths out the curve and removes any temporary fluctuations that have no bearing on the long-term trend.
In the context of the Hash Ribbon model, the Bitcoin hashrate MAs of interest are the 30-day and the 60-day versions. Here is a chart that shows the trend in these two ribbons over the last few years:

Looks like the two MAs of the metric have gone through a cross recently | Source: CryptoQuant
As you can see in the above graph, the Bitcoin 60-day MA hashrate has crossed above the 30-day version recently.
When this kind of crossover happens, it means the hashrate has been sharply falling recently as the 30-day average has fallen below the longer, 60-day one.
Historically, crosses like these have been bearish death crosses for the price since they are a signal of miner capitulation.
Crosses of the opposite kind, on the contrary, have always had a bullish effect on the price of the coin as they indicate that miners are optimistic on the outcome of BTC since they are expanding their operations.
The latest golden cross, however, took place a few months ago, but instead of a price rise, a decrease has followed it. Since the death cross is now already in, it would appear that for the first time in Bitcoin’s history, this bullish crossover has failed to bear any fruits.
BTC Price
At the time of writing, Bitcoin’s price floats around $17.3k, up 7% in the last week.

BTC seems to have shot up | Source: BTCUSD on TradingView
Featured image from mana5280 on Unsplash.com, charts from TradingView.com, CryptoQuant.com
