
TLDR
Bitcoin has plunged from its all-time high above $124,000 to around $113,000
The Fear & Greed Index has flipped to “fear” with a value of 44
Whales and institutions are buying the dip, showing confidence
Technical indicators suggest $109-112k could be optimal bounce zones
Four key conditions need to be met for a confirmed reversal
Bitcoin has seen a sharp decline over the past week, dropping from its recent all-time high above $124,000 to lows around $113,000. This 8% pullback has shifted market sentiment from months of greed to fear, with traders now watching for signs of a potential reversal.
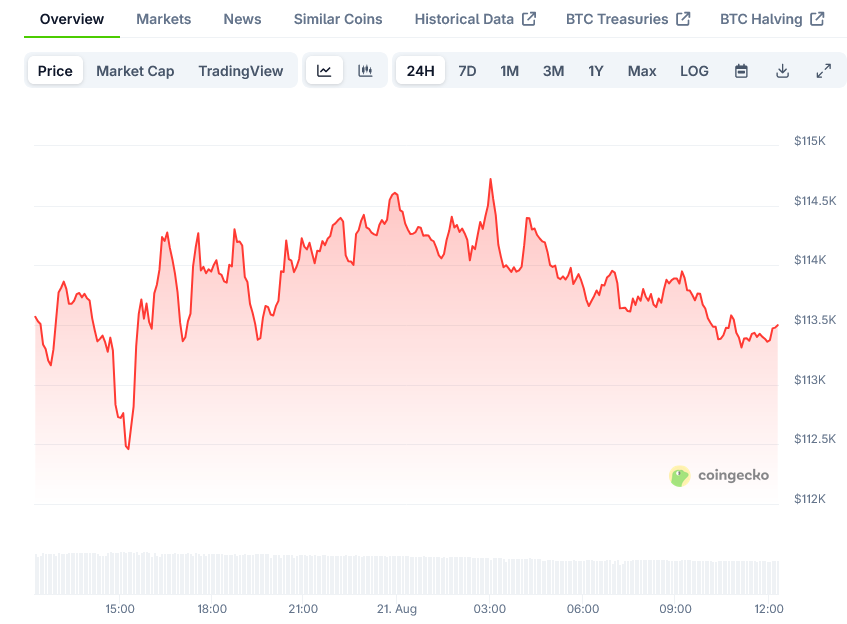
The cryptocurrency reached its peak just one week ago but has faced persistent downward pressure since then. The most recent drop saw BTC touch $112,400 before recovering slightly to around $113,800.
This price action has had a clear impact on market sentiment. After remaining in the “greed” zone since June, the Fear & Greed Index has now dropped to a value of 44, placing it firmly in the “fear” category.
The index determines investor sentiment by analyzing factors including trading volume, market cap dominance, volatility, social media activity, and Google Trends data.
Interestingly, this sentiment flip might actually be a positive indicator for Bitcoin. Markets often move contrary to majority expectations, with excessive fear potentially marking bottoms and extreme hype signaling tops.
Key Reversal Indicators
For Bitcoin to confirm a reversal from this downtrend, market analysts have identified four key conditions that need to be met.
First, the Bid-Ask Ratio across order books must turn and remain positive. This indicator has marked local bottoms on the last three occasions when it turned bullish.
Second, slippage spikes need to peak above 150. Historically, when BTC’s slippage has surpassed this value, prices have moved higher, indicating increased market volatility.
Third, the True Retail Accounts Long percentage needs to fully reverse. Current readings around 61.95% are approaching the historically bullish pivot point above 60%, potentially signaling a local bottom.
Finally, price must reclaim and hold above the 50-day Exponential Moving Average (EMA), which would confirm the shift in momentum.
Technical analysis shows that Bitcoin has broken below a rising wedge pattern and is trading under the 50 EMA, confirming the current bearish structure.
Whale Activity and Support Levels
While retail traders may be fearful, large investors appear to be taking advantage of lower prices. On-chain trackers have flagged significant whale purchases, including a single buy of 200 BTC worth approximately $23 million.
Bitcoin expert Adam Back commented on this trend, noting that “Dips exist to transfer Bitcoin from weak hands to stronger hands.”
The market is now watching several key support levels that could provide bounces. The 111-day Simple Moving Average sits at $109,600, while the 200-day SMA is at $100,400. The Short-Term Holder Realized Price provides another potential support at $106,800.
These zones have historically served as optimal areas for buyers to accumulate. Market analysts suggest that a liquidity sweep below $112,000-$113,000 could present an excellent entry point for long positions.
Data from Glassnode shows that supply held by “First Buyers” is approaching 5 million BTC, reinforcing the view that long-term holders and major players are dollar-cost averaging into the decline.
The current price level appears to have hit a potential zone of interest for buyers looking to accumulate. If history repeats itself, Bitcoin could rebound after this liquidity sweep before making new all-time highs.
Bitcoin’s previous drop in June coincided with a Fear & Greed Index value of 42, similar to current levels, and marked a bottom below $99,000 before a significant recovery began.
At present, Bitcoin’s price stands at $113,844, having dropped 1.57% in the past 24 hours. Most of the cryptocurrency market volume is now being traded in BTC pairs as traders closely watch for signs of a trend reversal.