TLDR:
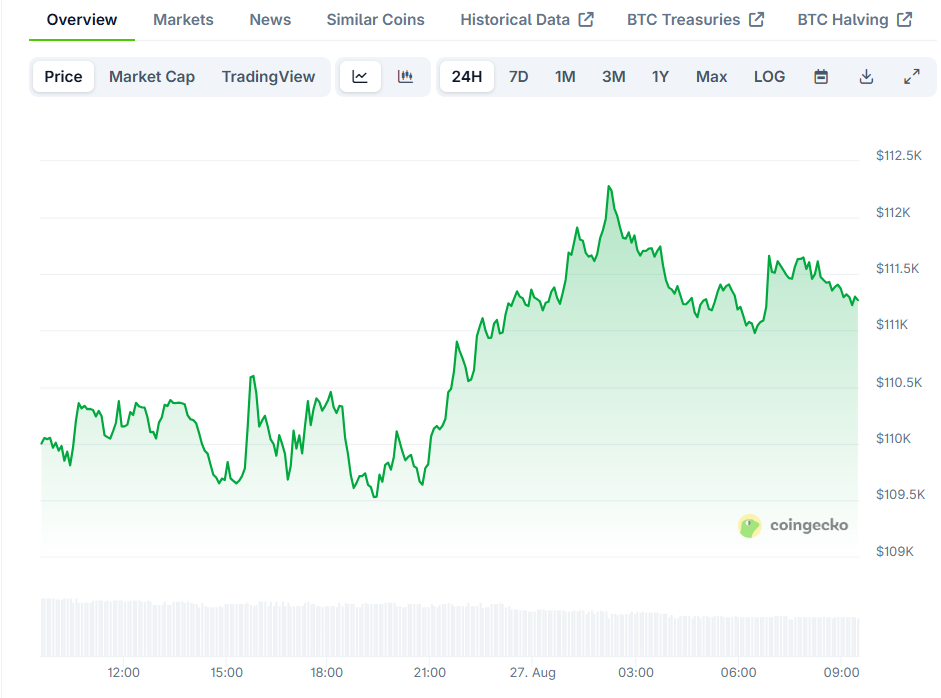
Bitcoin price stands at $111,300 with daily gains of 0.93% but a 7-day drop of 2.13%, per CoinGecko.
Analysts see Bitcoin correction 50–70% complete, with support near the 38.2% Fibonacci level and 200-day SMA.
Traders caution a move to 105K is still possible unless Bitcoin closes above 112K on the 4-hour chart.
Wave counts suggest Bitcoin may still face extended correction before momentum returns to bullish territory.
Bitcoin is back near the $111K mark, leaving traders split on what comes next. Some see the correction nearing its end. Others warn the pullback has room to stretch further.
Key levels on the charts are pulling attention as September approaches. Market watchers are tracking whether buyers can hold support or if another leg lower is on the horizon.
Bitcoin Price Correction Faces Key Support Levels
Analyst XForceGlobal said the ongoing correction in BTC looks between 50% and 70% complete. He noted that the broader structure lacked enough distribution for a clean follow-up move, hinting at the possibility of an extended wave pattern.
He explained that wave 2 may still unfold longer than expected, even through a WXY structure. In his view, sentiment in these phases often swings harder than in prior corrections, catching traders off guard.
[Medium Timeframe Analysis]
This is how I’m envisioning the current correction.
Overall, it’s really all in the same ball park of how we are narrating the correction. With more data, the easier it gets labeling these corrections with more conviction.
For now, I’m still… pic.twitter.com/EcUSM6rly9
— XForceGlobal (@XForceGlobal) August 26, 2025
The post highlighted the 38.2% Fibonacci retracement and the daily 200SMA as critical support, describing them as a magnet level for the market. He cautioned that manipulation around those areas could trigger wicks toward the 0.618 Fibonacci zone without breaking overall bullish structure.
He added that timing matches with a potential red September, making it possible that Bitcoin will extend the correction into the next month. According to him, traders often mistake short-lived bounces as the end, leaving them sidelined once the real reversal begins.
Resistance Near 112K Keeps Traders on Edge
AlphaBTC, another trader, said the lower time frame range is still guiding his outlook. He explained that Bitcoin remains capped by the June and July range until it clears higher.
📈#Bitcoin game plan 📈
Lower time frame view as $BTC attempts to break back out of the June / July range.
For me, until we get a H4 close above 112K I still feel 105K is in play, so I will be watching that level closely.#Crypto #BTC https://t.co/pUUFtwwVDX pic.twitter.com/vCfRVF7s5s
— AlphaBTC (@mark_cullen) August 27, 2025
For him, a decisive 4-hour close above $112K would signal strength. Until then, he believes $105K remains a level that could be tested. His plan is to track whether Bitcoin can escape the current zone or if it slides lower first.
Price data from CoinGecko shows Bitcoin trading at $111,300 today. The daily move reflects a 0.93% gain, though the weekly chart shows a 2.13% drop. Trading volume over the past 24 hours reached $39.5 billion, showing strong activity despite mixed sentiment.
With traders split on direction, Bitcoin’s path hinges on whether support holds or resistance breaks. For now, the correction narrative remains firmly in play as analysts weigh the next key move.