On-chain data shows Ethereum has observed massive inflows of $505 million into Binance during the past day, a sign that selling may be going on.
Ethereum Exchange Inflows Have Shot Up During The Past Day
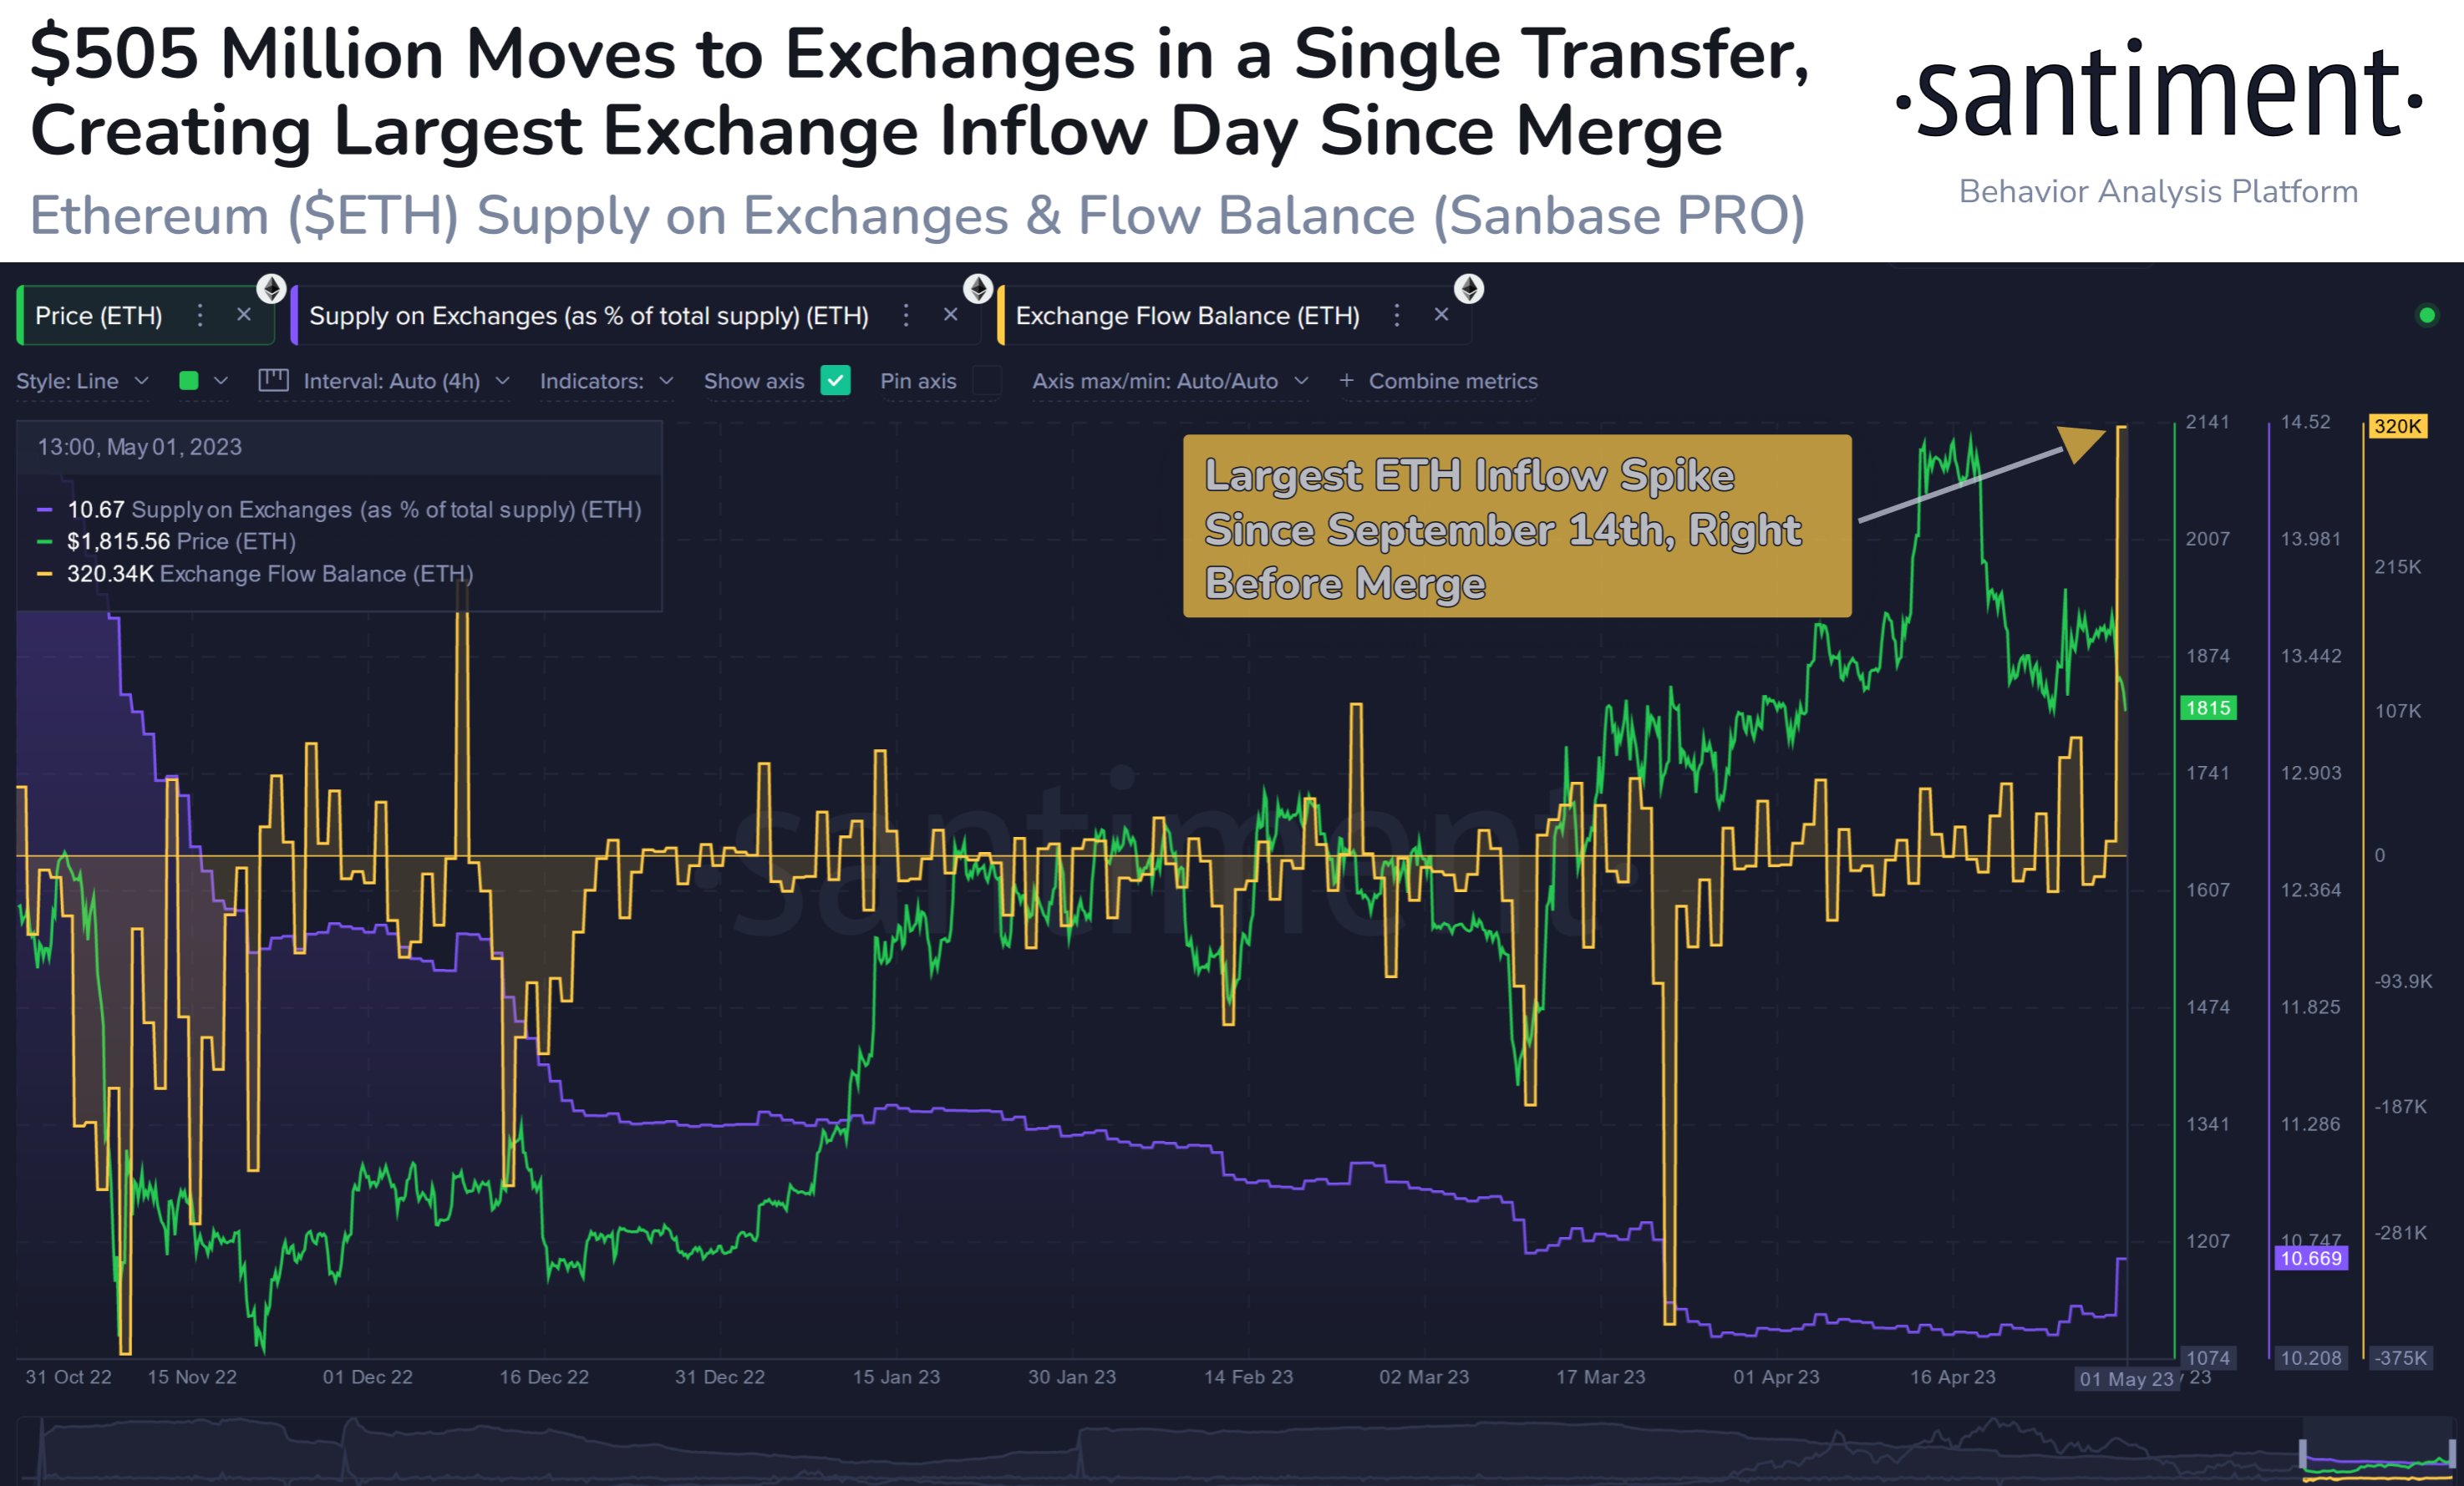
According to data from the on-chain analytics firm Santiment, this increase in the supply on exchanges is the largest observed since the day before the Merge. The “supply on exchanges” is an indicator that, as its name already implies, measures the percentage of the total Ethereum supply that’s currently sitting in the wallets of all centralized exchanges.
Related Reading: Bitcoin Bearish Signal: Miners Continue To Sell
When the value of this metric increases, it means investors are depositing some coins to exchanges right now. This kind of trend can have bearish consequences for the asset’s price as one of the main reasons why investors transfer their coins to exchanges is for selling-related purposes.
On the other hand, decreasing values of this indicator imply a net amount of ETH is exiting these platforms currently. Such withdrawals can be a sign that the holders are accumulating the cryptocurrency, which can naturally be bullish for the asset’s value in the long term.
Now, here is a chart that shows the trend in the Ethereum supply on exchanges over the last few months:
Looks like the value of the metric has shot up in recent days | Source: Santiment on Twitter
As displayed in the above graph, the Ethereum supply on exchanges has observed a sharp rise in the past day, meaning that investors have deposited a large amount of ETH to these platforms.
In the chart, there is also the data for another ETH indicator: the “exchange flow balance.” This metric measures the net number of coins that are flowing into or out of exchanges, meaning that the exchange flow balance essentially tracks the changes happening in the supply on exchanges indicator.
During the past day, this metric has seen a large positive value, suggesting that inflows have far surpassed the outflows in this period. According to the metric, around 320,000 ETH ($584.6 million at the current price) has entered into the wallets of the exchanges with this spike.
This net increase in the exchange supply is in fact the largest that the cryptocurrency has seen since September 14, 2022, the day before the transition towards the proof-of-stake consensus mechanism took place.
Interestingly, the vast majority of the inflow spike has been contributed by just one transfer, as data from the cryptocurrency transaction tracker service Whale Alert shows.
🚨 🚨 🚨 🚨 🚨 🚨 🚨 🚨 🚨 🚨 273,781 #ETH (504,986,096 USD) transferred from unknown wallet to #Binancehttps://t.co/WHqdlSQ5uB
— Whale Alert (@whale_alert) May 1, 2023
This transfer to Binance was worth almost $505 million, and it is one of the largest transactions between an unknown wallet and an exchange observed during the last five years.
It’s uncertain whether the whale has made this deposit with the intention to sell, or for using any other of the services offered by the platform. However, if selling is truly the goal here, then this massive inflow can be bad news for the asset’s price.
ETH Price
At the time of writing, Ethereum is trading around $1,800, up 1% in the last week.
ETH has gone down during the last couple of days | Source: ETHUSD on TradingView
Featured image from Kanchanara on Unsplash.com, charts from TradingView.com, Santiment.net

