Ethereum (ETH), the second largest cryptocurrency by market cap, experienced a price drop of over 3% within the last 24 hours. The reason is presumably a significant sell-off carried out by a prominent whale. The whale deposited 25,000 ETH (worth around $47.24 million) on Binance, only to withdraw a significant amount of USDT shortly afterwards.
As the on-chain data provider Lookonchain reports, the whale has probably already sold a part of his ETH. According to the on-chain data, the whale withdrew 16 million in USDT. “The drop in ETH price [a few hours] ago was most likely due to the sell-off of this whale,” the analysts note, further explaining that the whale still owns around 8,000 ETH ($14.7 million) unsold.
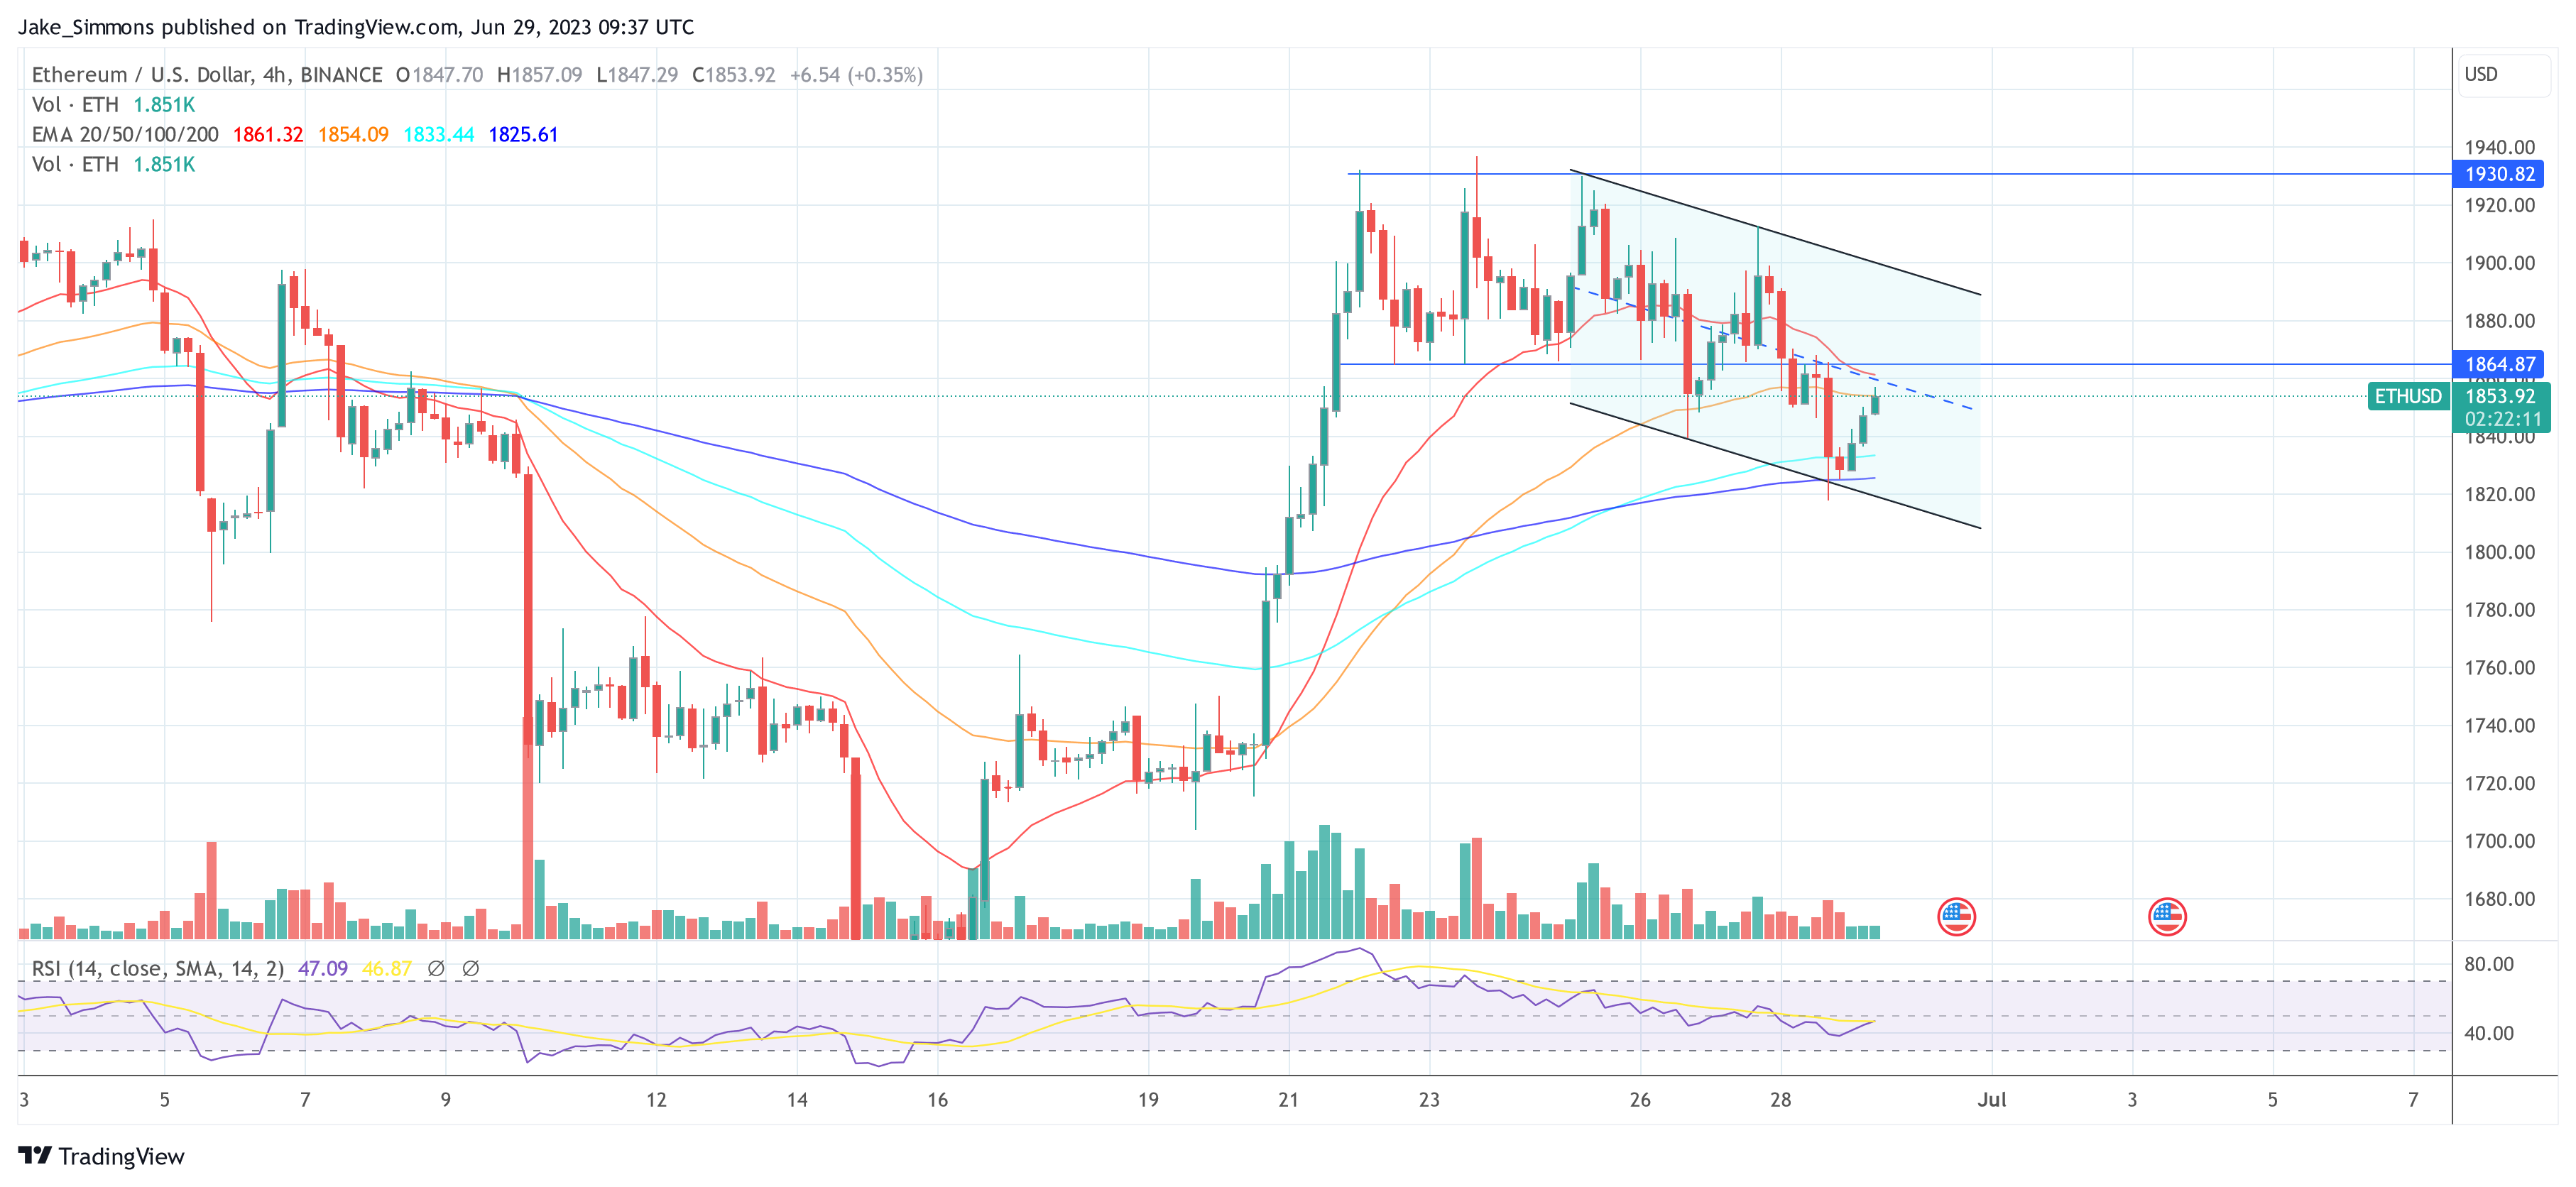
Nevertheless, ETH bulls continue to show strength. A look at the 1-hour chart of Ethereum reveals that the price has formed a bull flag. In technical analysis, a flag is a short-term consolidation pattern that occurs after a strong price move and indicates a temporary break in the trend.
A bullish flag forms during an uptrend with the flagpole pointing upwards, followed by a consolidation phase before a possible continuation of the upward movement. For now, the pattern has held, ETH has bounced up from the 4H 200 EMA at $1,825. In this respect, the bulls remain in control (despite the whale) for the time being.

Basically, two scenarios are conceivable. If the aforementioned support levels are broken to the downside, especially the underside of the flag, Ethereum could face a further price decline towards $1,750. Conversely, a breakout from the flag pattern to the upside (around $1,900) could trigger a price rise towards $2,000.
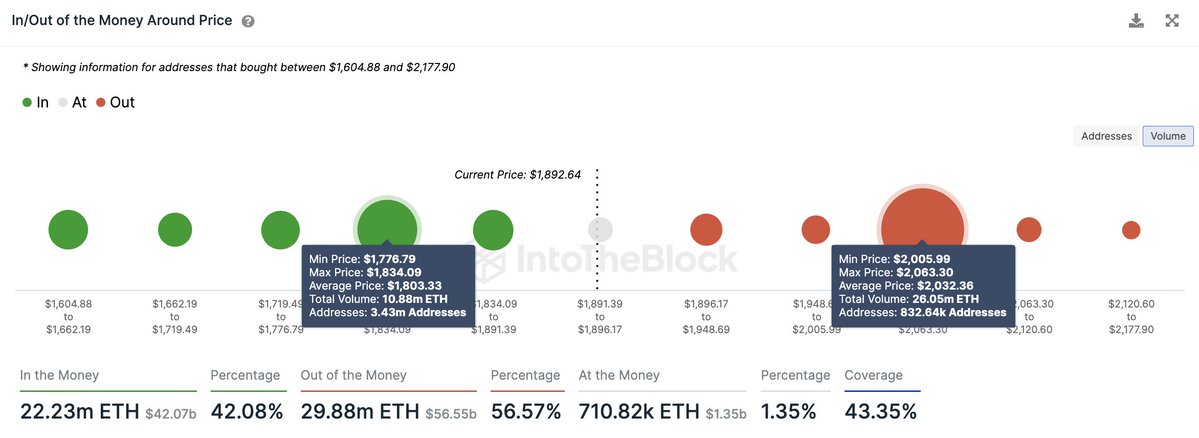
However, according to analyst Ali Martinez, that’s where the price will hit Ethereum’s key supply wall, which is in the $2,000 to $2,060 range, where 832,640 addresses have bought over 26 million ETH. “If ETH can break through this resistance barrier, we can expect an upswing to $2,330 or even $2,750,” Martinez believes.

Ethereum Options Expiry On Friday Confirms Outlook
The most important event this week for Bitcoin, Ethereum and the entire crypto market will be the expiration of over $7 billion in options tomorrow, Friday, June 30. The current options volume on the largest exchange Deribit is 14,107 calls, 9,445 puts and a put-call ratio of 0.67 for Bitcoin. For Ethereum, there are currently 76,776 calls, 39,779 puts and a put-call ratio of 0.52.
Options Volume [Deribit]$BTC: 📈Calls=14,107.70, 📉Puts=9,445.50, ⚖️Put-call ratio=0.67 $ETH: 📈Calls=76,776.00, 📉Puts=39,779.00, ⚖️Put-call ratio=0.52
— coinoptionstrack bot (@optionstrackbot) June 29, 2023
A put-call ratio below 1 typically means that the number of call options is higher than the number of put options, which indicates a more bullish market sentiment. In this case, the put-call ratio for ETH is 0.52, which means that there are more call options compared to put options. Thus, the ratio indicates that market participants are more prone to bullish bets on the ETH price.
Featured image from iStock, chart from TradingView.com
