Ethereum became the most deflationary in its history, as the annual supply dipped below zero for the first time since the Merge.
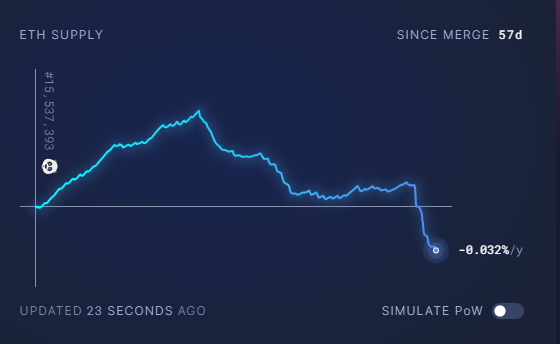
According to Ultrasound Money, the annual inflation rate has fallen to -0.032/year, which indicates that the network is now burning more Ethereum than its minting.

The negative inflation rate has decreased Ethereum’s net supply by 5,598 since Ethereum switched to proof-of-stake consensus on September 15.
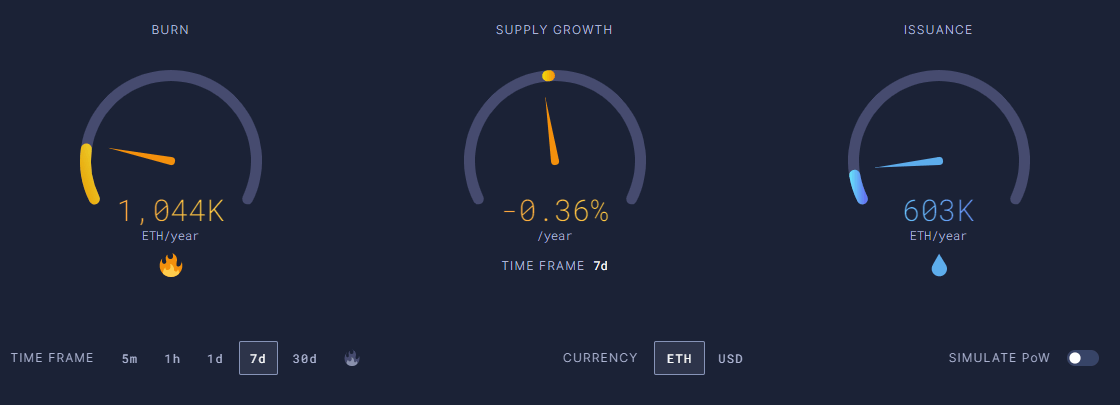
Within a 7-day timeframe, Ethereum has burned 1,044k tokens against 603,000 issued, a rate of 773,000 tokens per year, which shows ETH’s supply is going down by 0.36% per year.

The recent changes can be attributed to the Merge upgrade and the sudden rise in transactions due to market uncertainties.
After Ethereum’s upgrade from Proof-of-Work (PoW) to Proof of Stake(PoS), Ethereum became a deflationary asset. The upgrade replaced miners with validators replaced in running the blockchain, causing a significant reduction in newly minted ETH. As a result, Ethereum’s annualized inflation rate dropped to nearly zero after the Merge, but it took some time to reach the current level.
Moreover, the recent surge in Ethereum network activity during the FTX debacle increased ETH burn.
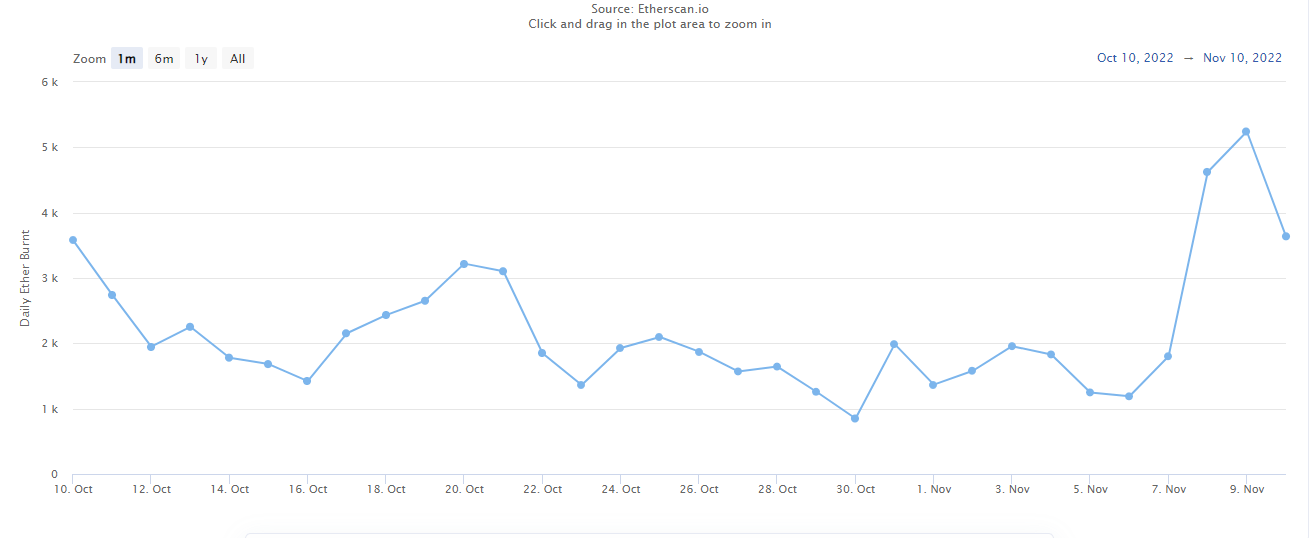
Recently, Etherscan reported the highest daily tally since June, as 5,242 ETH burned on Wednesday. The amount of ETH burned this week was over 15,305 as of Thursday.

Source: Daily ETH Burn
In total, 2.72 million ETH have been burned on the Ethereum network since August 2021, after the Ethereum Improvement Proposal (EIP)-1559 went live. In essence, the EIP relates ETH burn to network usage.
Ethereum to outperform Bitcoin?
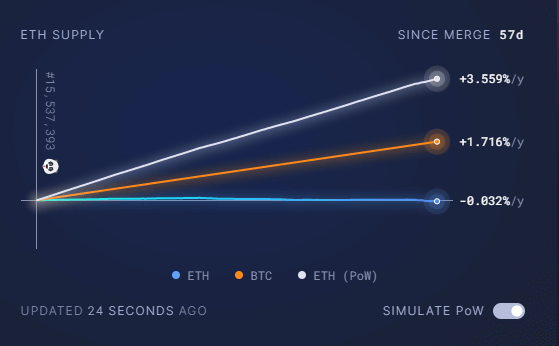
In contrast, on PoW the inflation rate of Ethereum was 3.559% per year, with 4,931k Ethereum being issued annually. On the other hand, Bitcoin has a growth rate of 1.716% per year.

Ether’s deflationary prospects may boost its scarcity overall, and when the panic caused by the FTX fades, Ether’s tokenomics could outperform bitcoin.
Currently, Ethereum is trading at $1277.15, down 29.4% from its 7-day high of $1653.29.
