
TLDR
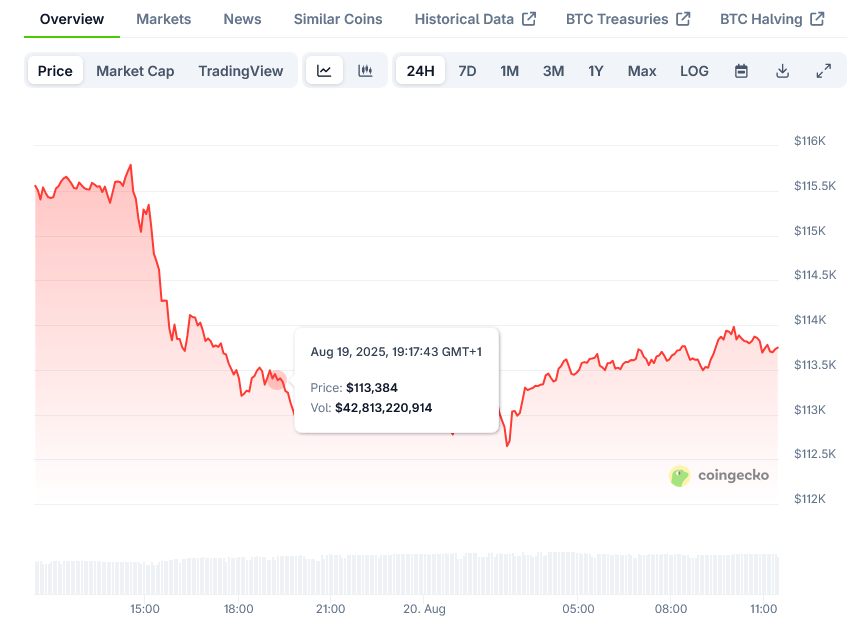
Bitcoin fell to $112,600, marking a 17-day low and an 8.5% retreat from its recent all-time high
Retail traders have flipped from bullish to “ultra bearish” according to Santiment analysis
Technical breakdown from an ascending triangle pattern with neckline support at $112,000
Historical bull market cycles suggest this could be a healthy “bear trap” correction
Institutional buyers like Metaplanet and Strategy continue purchasing during dips
Bitcoin has taken a significant downturn, retracing to $112,600 in late trading on Tuesday. This marks a 17-day low for the leading cryptocurrency, which has now retreated 8.5% from its all-time high of just over $124,000 reached last week.
The pullback has triggered a wave of panic selling among retail traders. According to blockchain analytics firm Santiment, retail sentiment has done “a complete 180” after Bitcoin failed to rally and dipped below $113,000.
This shift in sentiment represents the most bearish outlook on social media since June 22, when fears of war in the Middle East caused a cascade of selling.
The total cryptocurrency market capitalization has also dropped below $4 trillion to a two-week low, reflecting broader market concerns.
The Bitcoin Fear & Greed Index has slipped into “Fear” territory with a rating of 44 out of 100, its lowest level since late June.
Historical Perspective on Market Corrections
Market corrections during bull cycles are nothing new and represent a healthy part of the larger market cycle. Similar pullbacks, often called “bear traps,” occurred at comparable stages in previous bull market years.
In the 2017 bull market, Bitcoin corrected by 36% in September before surging to a new peak three months later.
A similar scenario played out in September 2021 when BTC corrected 23% before reaching a new all-time high later that year.
If history repeats, and the correction reaches similar depths in 2025, Bitcoin could pull back as low as $90,000 next month before recovering to set new records.
Technical Analysis Points to Key Support Levels
From a technical standpoint, Bitcoin has broken below an ascending triangle pattern and the 50-day Simple Moving Average at $115,870, which now acts as resistance.
The daily chart shows a head-and-shoulders pattern forming with neckline support at $112,000. A clean break below this level could accelerate the decline to $108,000, with an extended target at $105,150.
Technical indicators confirm this outlook. The Moving Average Convergence Divergence (MACD) has turned negative, and the Relative Strength Index (RSI) sits at 41, which is not yet in oversold territory.
This suggests there’s room for more downside before a strong bounce occurs.
However, the broader picture remains intact. Looking at the longer timeframe, Bitcoin still maintains a sequence of higher lows since June.
Small-bodied candles forming at the $113,000-$114,000 range – including dojis and spinning tops – indicate market indecision rather than capitulation.
For traders watching key levels, the bullish case depends on Bitcoin reclaiming $116,150, which could trigger a bounce to $120,900. Breaking above $124,450 would open up retests of $127,540 and potentially higher.
The bearish case hinges on a break below $112,000, which could push prices down to $108,000. Traders taking short positions should place stops above $116,000.
Despite the near-term selling pressure, institutional buying and long-term holders continue to provide support. Companies like Metaplanet and Strategy are actively buying during these dips, suggesting broader sentiment has not turned bearish.
The next few weeks will be critical for Bitcoin’s price direction. A failure to hold $112,000 could take BTC toward $100,000, while a break above resistance could put $130,000 back in play if macroeconomic conditions stabilize.
For long-term investors, the structural bullish trend remains intact, with analysts viewing this correction as part of an accumulation phase rather than the end of the rally.
Santiment analysts note that negative social sentiment is actually a positive signal for dip buyers, especially when there is “blood in the streets and fear is maximized.” They suggest that the panic selling could be a “good sign of an upcoming dip bounce.”
Bitcoin last traded at $113,400, down over 2.75% in the last 24 hours.