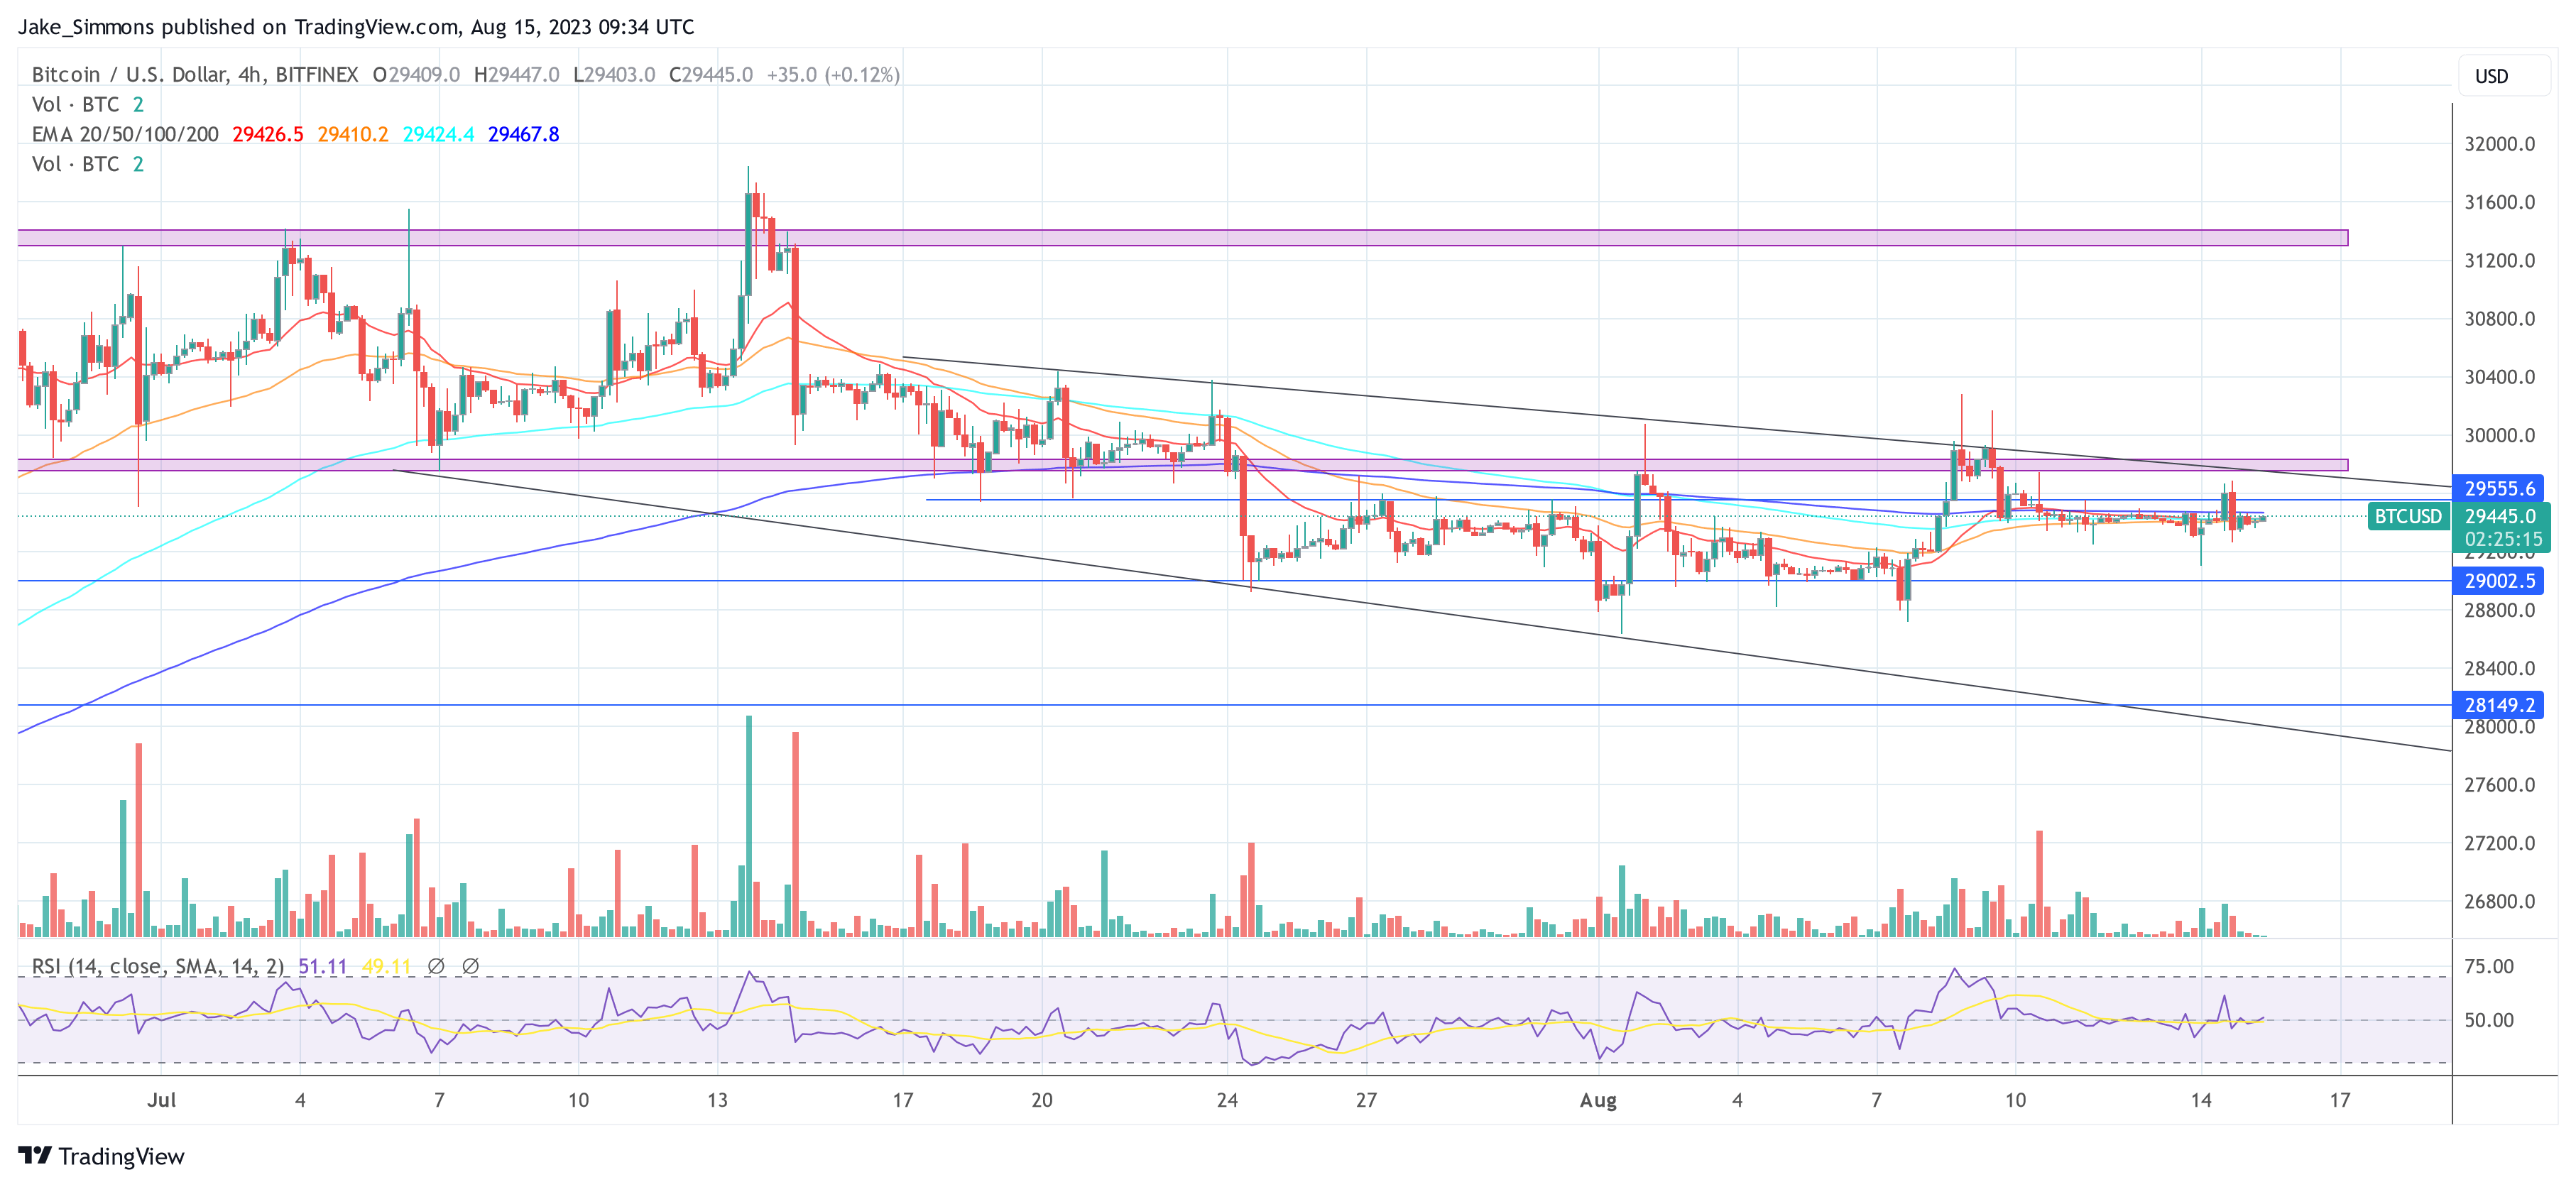
In today’s micro update from Capriole, founder Charles Edwards presented a compelling analysis that draws parallels between the current low volatility of Bitcoin and its historical behavior in 2016. With Bitcoin’s price stagnating around the $29,000 mark, experts are closely watching for signs of a potential bullish breakout.
“Bitcoin’s price remains at $29K, in a sideways consolidation that has created one of the absolute lowest volatility periods in Bitcoin’s 14 year history,” Edwards states. This prolonged period of low volatility is reminiscent of 2016, suggesting that a significant price movement could be imminent.
Bitcoin Breakout Imminent?
While the technicals indicate a bearish breakdown from the $30,000 mark, the absence of a downward momentum offers a glimmer of hope for bullish investors. “If price was going to collapse, we would usually have seen that follow through by now,” the report notes. However, for a more concrete bullish sentiment, “a close back above $30K on the daily timeframe is required at the minimum as a technical confirmation of a failed breakdown.”
On the fundamental front, Bitcoin’s on-chain data continues to contract, albeit at a decelerating rate. The imminent decisions on several Bitcoin ETF approvals could potentially disrupt the current low volatility phase. “An approval could cause a break from the current low volatility range. Best not to pre-empt this though, as these decisions often get pushed. Confirmations are key to mitigate risk,” Edwards cautions.
Diving deeper into the technicals, the report highlighted two key observations:
Since 2010, Bitcoin’s historic volatility has only been lower than today in 2016. Suggesting a big price move is on the horizon when volatility expansion (reversion to the mean) occurs.
Bitcoin’s $30K breakdown has (so far) failed to follow through… A close back into the Wyckoff structure at $30K would signify a failed breakdown and therefore be a very positive technical signal.
BTC On-Chain Indicators Are Neutral
Capriole’s Bitcoin Macro Index, a comprehensive tool that amalgamates over 40 Bitcoin on-chain, macro market, and equities metrics into a machine learning model, currently scores at -0.36, indicating “Contraction”. This suggests that while the short-term outlook remains neutral, the long-term perspective appears bullish. Remarkably, this strategy takes long-only positions in Bitcoin. In slowdowns and contractions, cash is held.
“The Macro Index today remains in a period of relative value (below zero), suggesting decent long-term value for multi-year horizon investors,” the report elucidated.
A noteworthy addition to Capriole’s analysis toolkit is the “Bitcoin Production Cost” model, which evaluates the cost of mining a Bitcoin based on global average electrical consumption. Currently, this model indicates that Bitcoin is trading within a long-term value region, with the report speculating, “I would be surprised if this holds into 2024.”
In conclusion, the analysis from Capriole paints a picture of potential long-term value amidst the current bearish technicals. Drawing parallels with 2016, the report suggests that Bitcoin’s current low volatility phase could be a precursor to a bullish breakout.
“All else equal, Bitcoin is like a beach ball submerged underwater. Nonetheless, we remain in a technical breakdown. We don’t know how long that hand will hold the ball underwater for. Prudent risk-management will await a technical confirmation before acting.”
With the cyclical nature of Bitcoin’s expansion and contraction cycles, only time will tell if history will indeed repeat itself; especially with the backdrop of a totally different macro environment. At press time, the BTC price remained stagnant, trading at $29,445.

Featured image from André François McKenzie / Unsplash, chart from TradingView.com
