On-chain data shows Bitcoin whales have continued to put selling pressure on the market as the price of the crypto now drops below $20k.
Bitcoin Exchange Whale Ratio Has Spiked Up To High Values
As pointed out by a post from CryptoQuant, the exchange inflows that followed the US CPI release lead to the price crashing 10% in only a couple of hours.
The “exchange whale ratio” is an indicator that measures the ratio between the sum of the top 10 Bitcoin transactions to exchanges, to the total exchange inflows.
Since the ten largest transfers to exchanges are usually from the whales, this metric’s value tells us how much of the total inflows are coming from these humungous holders.
When the value of the ratio is high, it means whales are making up for a large part of the total transactions to exchanges. Such a trend can be a sign of dumping from this cohort.
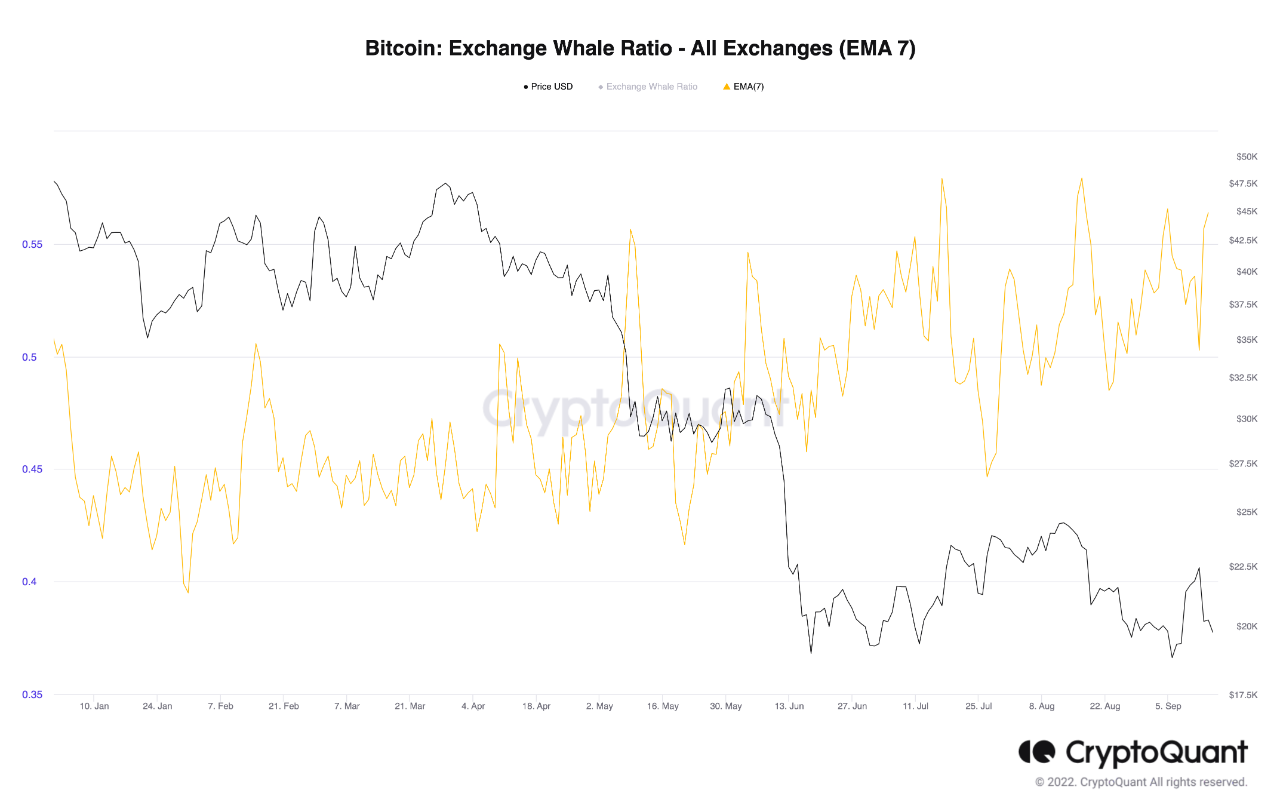
Now, here is a chart that shows the trend in the Bitcoin exchange whale ratio (EMA 7) over the year 2022 so far:

The value of the metric seems to have been quite high in recent days | Source: CryptoQuant
As you can see in the above graph, the 7-day exponential moving average of the Bitcoin whale ratio has been elevated recently. This shows that a big part of the recent activity on exchanges has been coming from these holders.
Another indicator, the Spent Output Value Bands, tells us what the individual contributions to the inflows are from the different holder groups in the market. Investors are put into these cohorts based on the amount of BTC they are holding in their wallets.
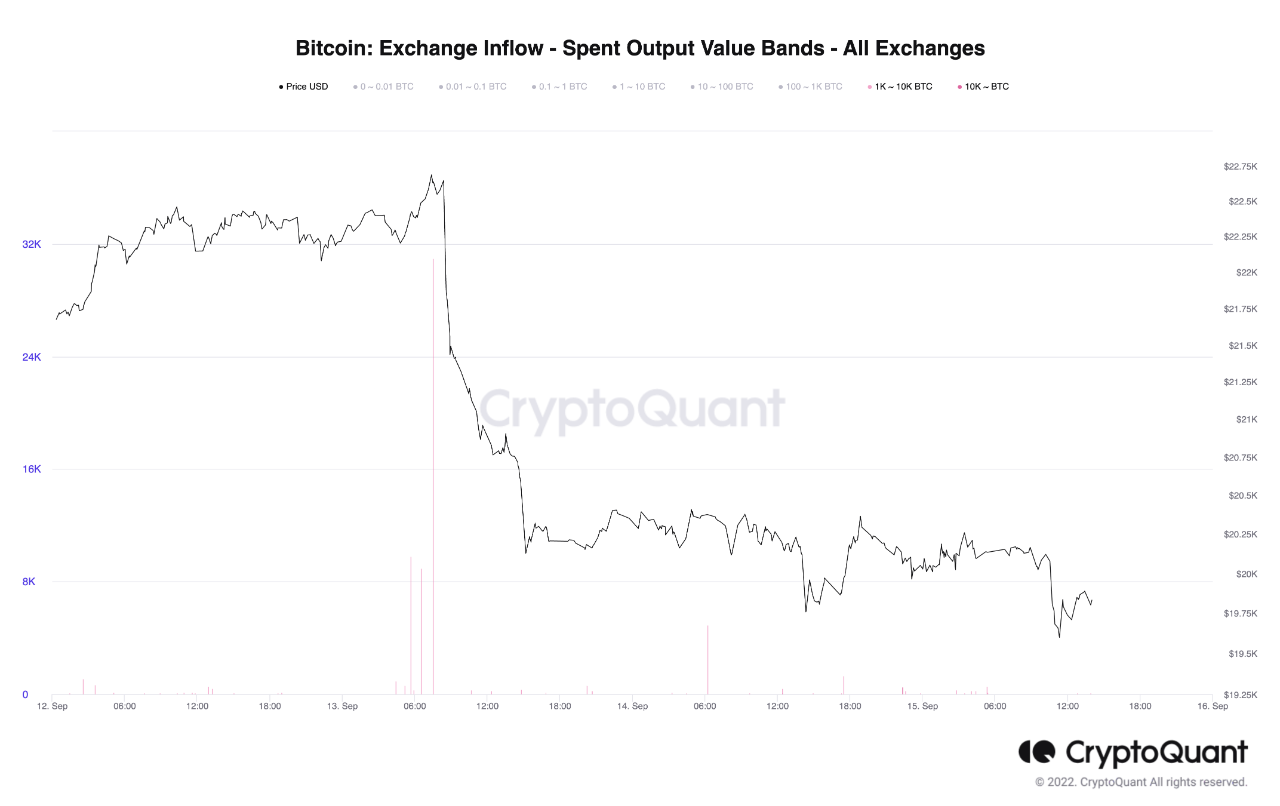
The below chart shows the trend in this metric specifically for the 1k to 10k BTC and 10k+ BTC holder groups.

Looks like the two cohorts have been active in recent days | Source: CryptoQuant
As the graph shows, both the whales holding between 1k to 10k BTC and those with 10k or more BTC have actively contributed to the exchanges recently.
A few large spikes from them came right before the recent plummet in the Bitcoin price that took its value down to $20k.
The quant in the post notes that later today’s values of the exchange whale ratio can be important in judging how severe its moving average is going to be.
BTC Price
At the time of writing, Bitcoin’s price floats around $19.7k, down 6% in the past week.

The value of the crypto has dipped below $20k now | Source: BTCUSD on TradingView
Featured image from Andrew Bain on Unsplash.com, charts from TradingView.com, CryptoQuant.com
