On-chain data shows Bitcoin long-term holders have ramped up their selling recently, something that could lead to further plunge in the crypto’s price.
Bitcoin Exchange Inflow CDD Has Spiked Up Over The Last Day
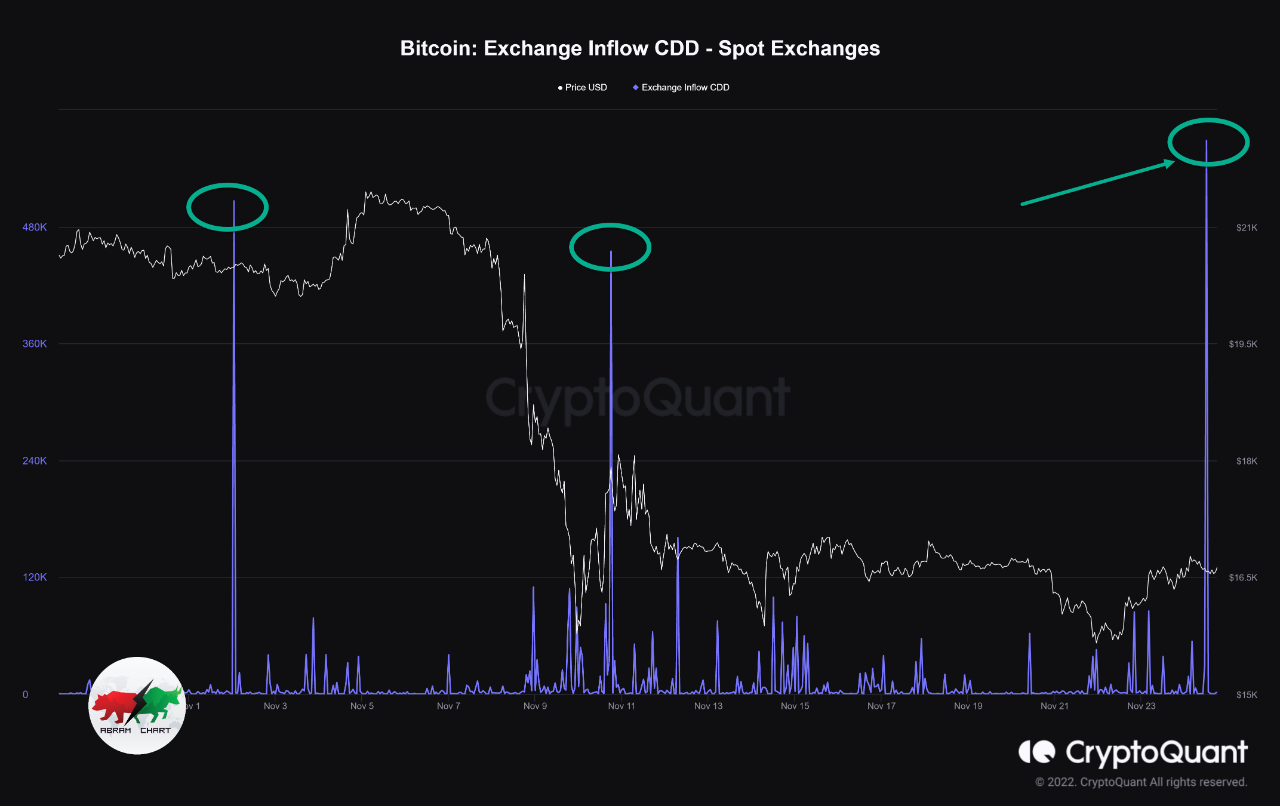
As pointed out by an analyst in a CryptoQuant post, the current rise in the CDD is the largest since 6th October.
A “Coin Day” is the quantity that 1 BTC accumulates after staying still for 1 day in a single address. If a coin that has amassed some number of Coin Days finally moves to another wallet, its Coin Days counter resets, and the Coin Days are said to be “destroyed.”
The “Coin Days Destroyed” (CDD) metric keeps note of the total number of such Coin Days being destroyed throughout the network on any given day.
Another version of this indicator is the “exchange inflow CDD,” which measures only those Coin Days that were reset because of transactions to centralized exchanges.
Now, here is a chart that shows the trend in the Bitcoin exchange inflow CDD over the past month:

The value of the metric seems to have spiked up during the last day or so | Source: CryptoQuant
As you can see in the above graph, the Bitcoin exchange inflow CDD has shown a sharp rise in its value recently.
There is a cohort in the BTC market called the “long-term holder” (LTH) group, which includes all investors who hold onto their coins for long periods without moving them.
Related Reading: Bitcoin Capitulation Deepens As aSOPR Metric Plunges To Dec 2018 Lows
Because of the dormancy of their coins, thes LTHs accumulate a large numbers of Coin Days. As such, whenever these holders do move their coins, the CDD usually spikes up due to the scale of Coin Days involved.
The current spike in the Bitcoin exchange inflow CDD thus suggests that some LTHs have deposited their coins to exchange wallets.
As the exchanges in question are spot platforms, it’s possible that this movement of coins was made for selling purposes.
From the graph, it’s apparent that both the previous big spikes in the indicator were followed by declines in the price of Bitcoin.
If the latest surge was also because of LTHs preparing to dump their coins, then the crypto is likely to observe bearish trend this time as well.
BTC Price
At the time of writing, Bitcoin’s price floats around $16.4k, down 2% in the last week. Over the past month, the crypto has lost 15% in value.

Looks like the price of the coin has been back to moving sideways in the last few days | Source: BTCUSD on TradingView
Featured image from Zdeněk Macháček on Unsplash.com, charts from TradingView.com, CryptoQuant.com
