Bitcoin has sharply rebounded back to $20.4k, but is the decline actually over? This on-chain metric may suggest otherwise.
Bitcoin Coin Days Destroyed Metric Has Spiked Up Over The Past Day
As pointed out by an analyst in a CryptoQuant post, BTC Coin Days Destroyed is showing a spike at the moment.
A “coin day” is the amount that 1 BTC accumulates after sitting still on the chain for 1 day. When any coin with some number of coin days shows any movement, its coin days reset back to zero, and are said to be “destroyed.”
The “Coin Days Destroyed” (CDD) indicator measures the total amount of such coin days currently being destroyed on the Bitcoin network.
When the value of this metric is high, it means a large number of dormant coins are being transferred on the chain right now. This kind of trend can be a sign of dumping in the market.
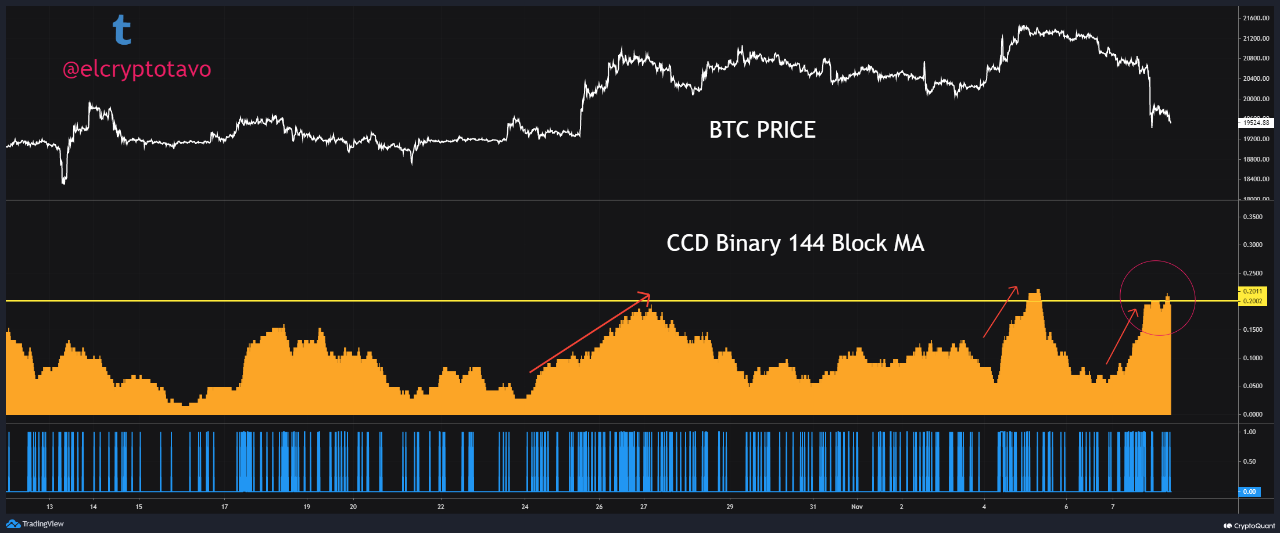
Now, here is a chart that shows the trend in the Bitcoin CDD over the past month:

The value of the metric seems to have been quite high over the last twenty-four hours | Source: CryptoQuant
As you can see in the above graph, the Bitcoin Coin Days Destroyed has observed a spike during the past day.
In the last few weeks, there have also been two other instances where the indicator has seen surges of similar values.
Following each of these spikes, the price of the crypto has gone down, though the magnitude of the decline has differed between each of them.
Generally, such large values of the CDD suggest movement from the long-term holders (LTHs), a cohort that holds strong onto their coins for extended periods.
Because of this conviction, LTHs tend to accumulate a large number of coin days, which is why when they move to sell their coins, coin days in great quantities get destroyed, and the CDD registers this as a spike.
Thus, it’s possible that it was this dumping from the LTHs that lead to those declines in the previous instances.
In the last 24 hours, the Bitcoin price plunged below $20k right after the CDD saw its surge, but as is apparent from the chart, the metric still hasn’t winded off just yet.
So far, the crypto has actually sharply rebounded back up above $20k, but it remains to be seen if this retrace will be short lived, or if the CDD will start to die off.

BTC has sharply surged up in the last few hours | Source: BTCUSD on TradingView
Featured image from André François McKenzie on Unsplash.com, charts from TradingView.com, CryptoQuant.com
