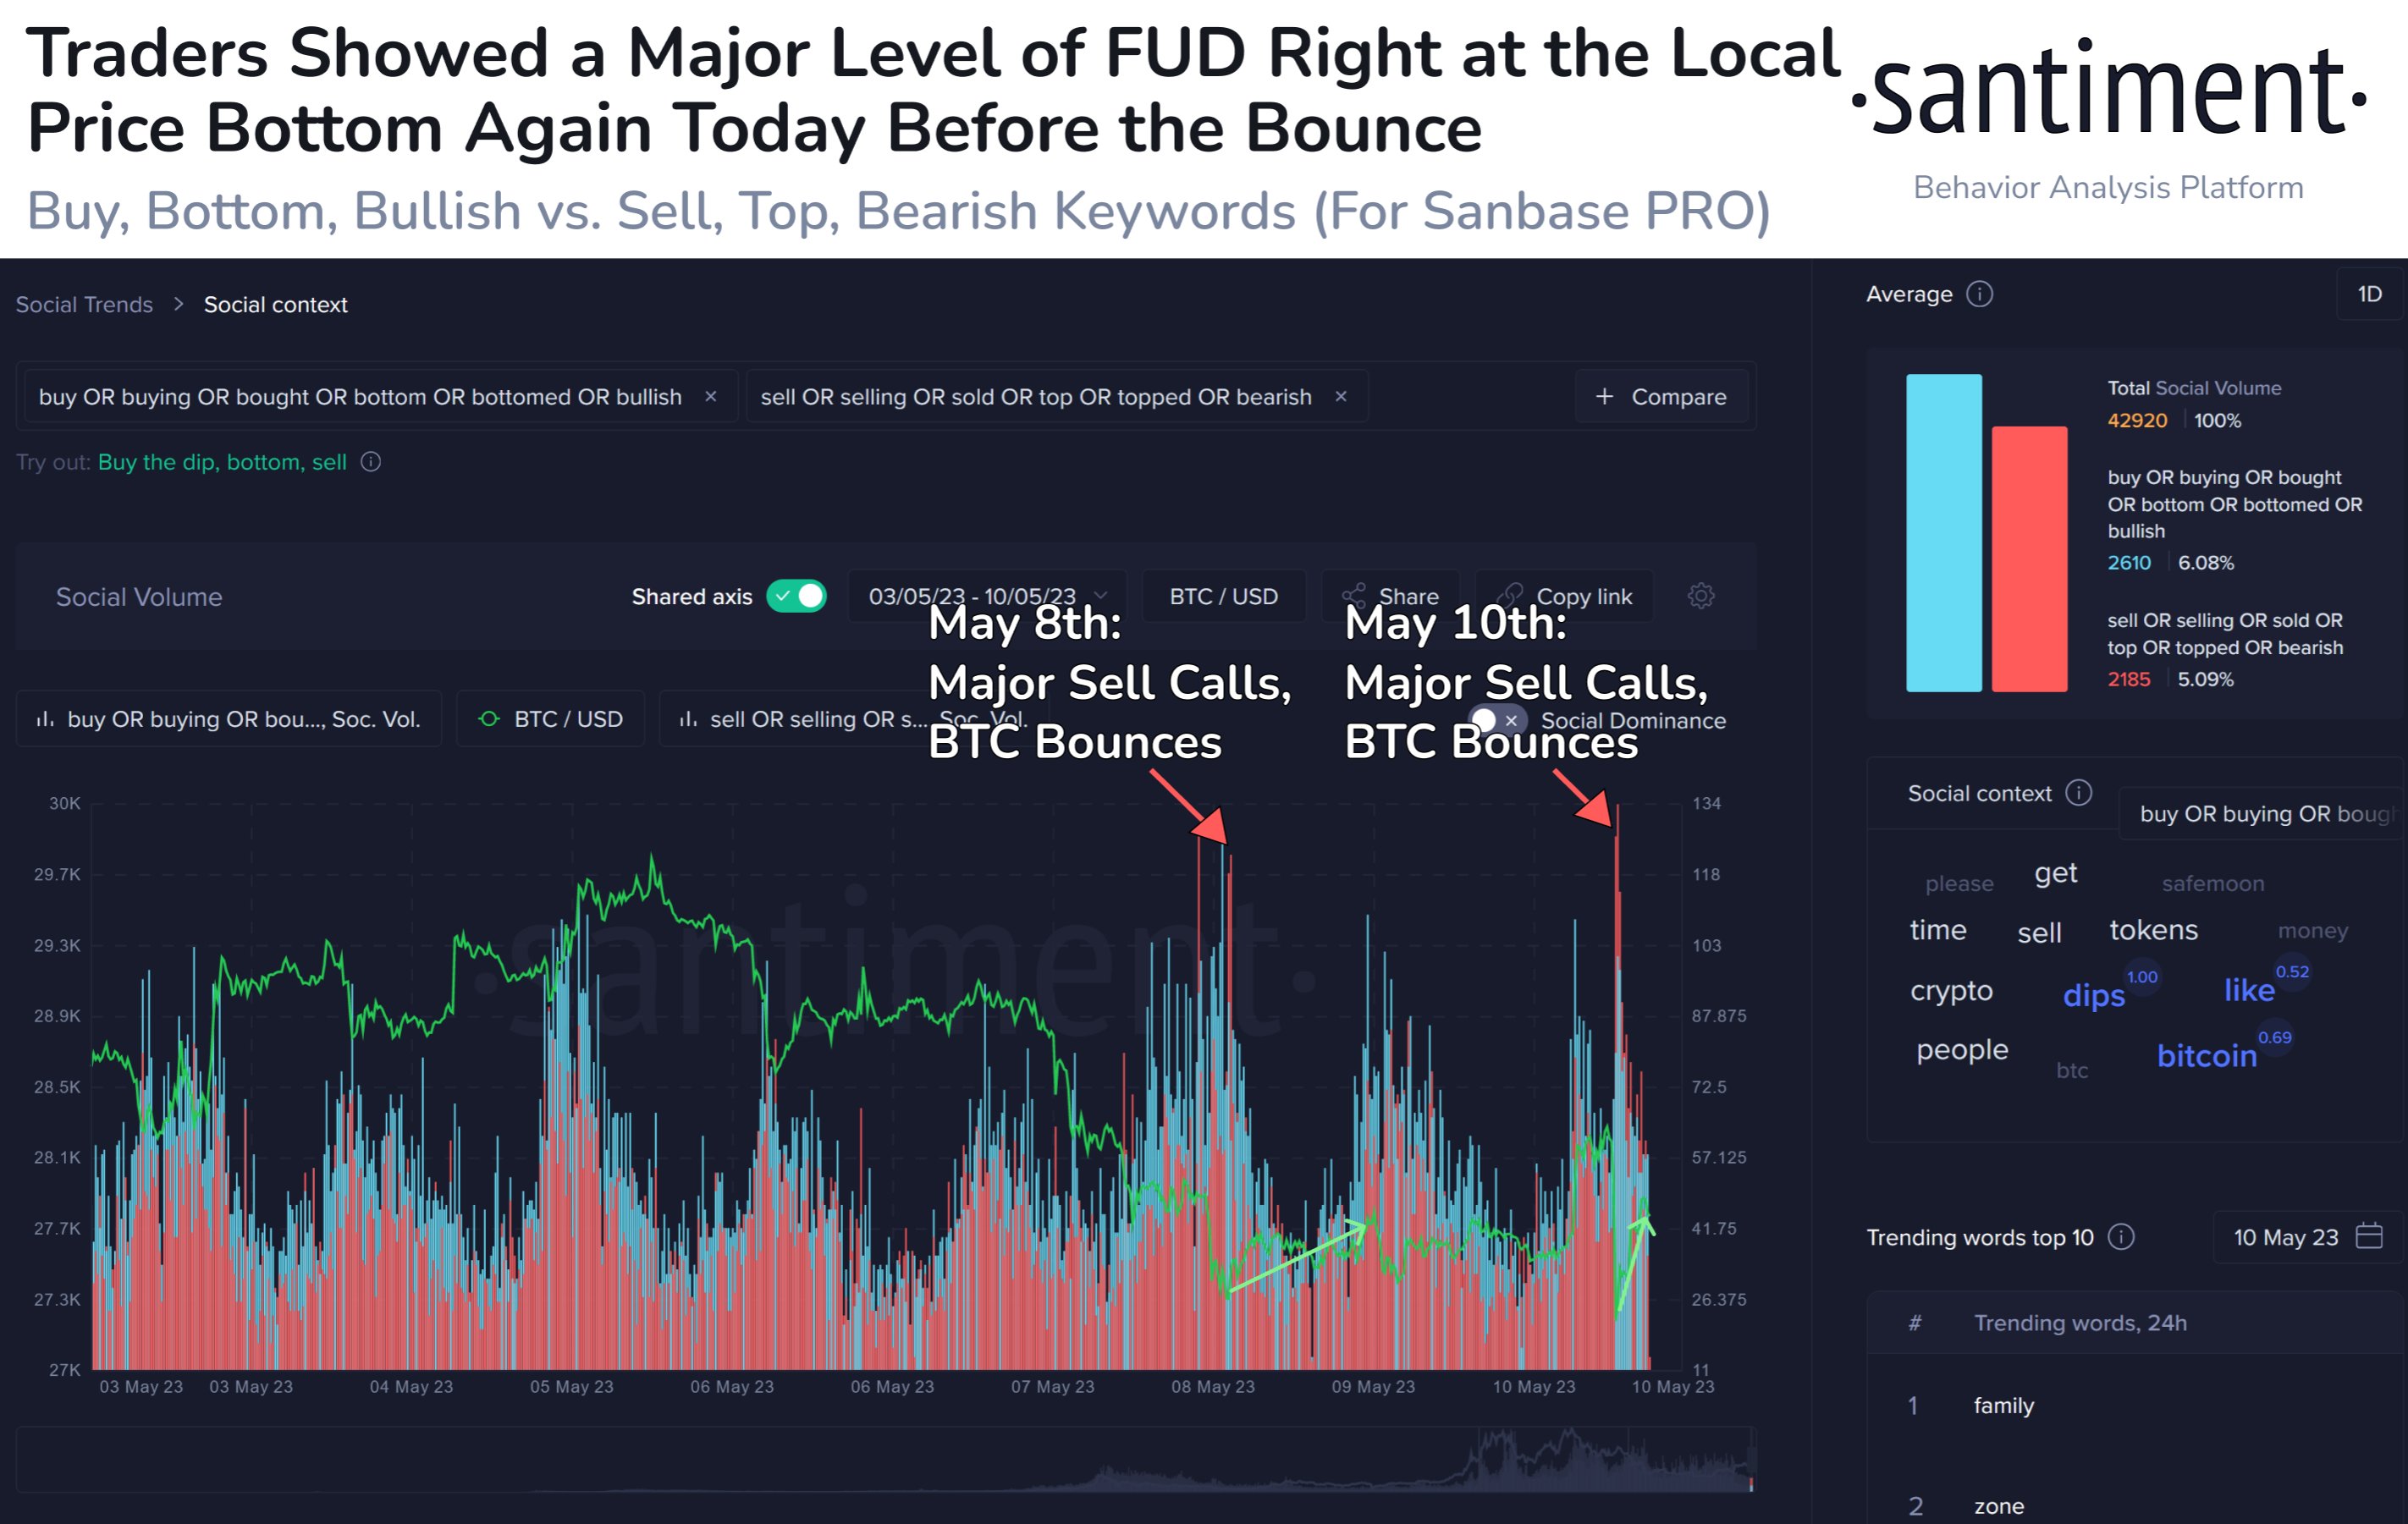
Data shows the Bitcoin sentiment had turned quite bearish just before the asset’s price had rebounded up from the $27,100 level.
Bitcoin Recovers Shortly After FUD Takes Over Market
According to data from the on-chain analytics firm Santiment, investors showed high levels of fear around the time of the local bottom during the past day. The relevant indicator here is the “social volume,” which measures the total number of social media text documents that mention a given topic like cryptocurrency or Bitcoin.
These social media text documents include a variety of sources, like Reddit, Twitter, Telegram, and other forums. The social volume only tracks how many such documents mention the term at least once. So this means that even if a post contains the keyword several times, its contribution to the social volume will still be only one unit.
The significance of the social volume is that it tells us about the amount of discussion that certain topics are getting from social media participants at the moment.
In the context of the current topic, social media is used to know the degree of the bearish and bullish sentiments in the market. Here is a chart that shows the trend in these social volumes for Bitcoin over the last week:
Looks like the bearish sentiment has seen a sharp surge recently | Source: Santiment on Twitter
To separate the social volume for discussions that imply a bullish mentality, terms such as “buy, bottom, bullish” have been chosen, while keywords like “sell, top, bearish” are the ones selected for pinpointing a bearish sentiment.
As displayed in the above graph, the Bitcoin social volume for the bearish sentiment seems to have observed a large spike during the past day. This surge in the indicator had come after BTC had plunged from above $28,000 to around $27,100.
This suggests that the BTC investors had turned very fearful during this panic selloff. A similar level of bearish sentiment was also observed only a couple of days back, as the chart highlights.
The turn in market mentality back then had also come following a decline (this time from the $29,000 mark to the low $27,000 levels), and interestingly, it had coincided with the local bottom in the price.
The spike this time has also occurred simultaneously with the possible local bottom formation at $27,100, as the price of the cryptocurrency has recovered a little bit since then.
Historically, whenever the market has held an opinion too unbalanced in any particular direction, the price has tended to move opposite to this opinion of the masses. Because of this, in times when the market has seen large amounts of greed, a local top has generally become more probable.
Naturally, the same goes for local bottoms as well, since they have usually formed when FUD has taken over the minds of the investors. The recent spike appears to have been an example of this pattern, and so far, it looks like the latest bearish sentiment spike may also be the same.
BTC Price
At the time of writing, Bitcoin is trading around $27,500, down 5% in the last week.
BTC seems to have been moving sideways in the last few days | Source: BTCUSD on TradingView
Featured image from Maxim Hopman on Unsplash.com, charts from TradingView.com, Santiment.net

