The crypto market has returned to the green with Bitcoin price pushing north of $20,000 after a severe rejection from those levels in August. The market is heading into the weekend, and with two major events in the next few days, there could a spike in volatility.
At the time of writing, Bitcoin price trades at $21,000 with a 10% and 4% profit in the last 24 hours and 7 days, respectively. Data from Coingecko shows that BTC is overperforming in the crypto top 10 by market cap as other assets lag and present minor losses.

Bitcoin Price Near Overhead Resistance, Can Bulls Push Through?
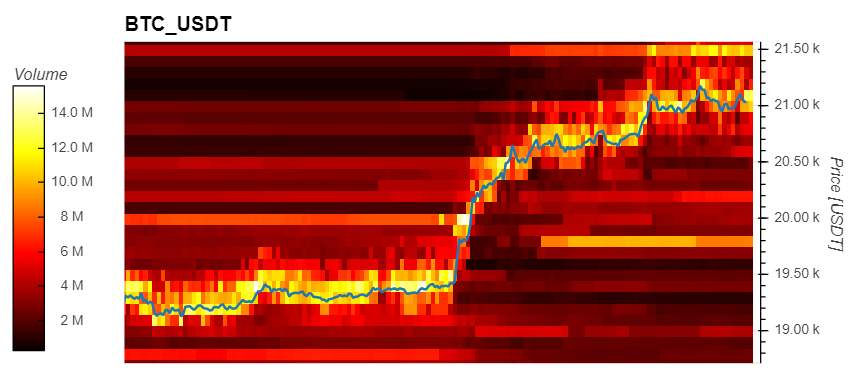
As Bitcoin flirts with its current levels, data from Material Indicators (MI) have begun showing liquidity on the move. The benchmark crypto was able to fill over $15 million in asks orders as it broke past critical resistance at $20,000.
Now, the most important level of resistance stands at $21,500, for the short term. At those levels, the Bitcoin price is seeing selling orders stacking from $7 million to around $12 million in the past 12 hours. These orders might operate as resistance and slow down any attempts from the bulls to reclaim higher levels.

Material Indicators show that the current price action is being bought by retail investors and by large investors with buying orders of over $100,000. If Bitcoin price is to show a bullish continuation, the latter should continue to bid and support the cryptocurrency.
However, investors with $100,000 bid orders have stayed flat as BTC’s price trends to the upside. This hints at a potential re-test of support with $19,500 to $19,800 as potential targets to prevent further losses and preserve short-term bullish bias.
Bitcoin Price Critical Levels On Higher Timeframes
Additional data provided by Caleb Franzen, Senior Market Analysis for Cubic Analytics, shows that Bitcoin has displayed a similar price action across 2022. In previous months, the cryptocurrency’s downside trend has been followed by periods of consolidation.
As seen below, these periods have hinted at more downside. Thus, it is critical that Bitcoin price reclaims north of $25,000, $28,000, and $32,000, or the market risk a slow bleed into fresh lows. Franzen said while sharing the following chart
Bitcoin consolidated for 107 days starting in early Q1 2022 before breaking down for the next leg lower. The current consolidation range has lasted for 83 days. I don’t expect the current market will match the 107-day range, but it’s worth noting that they can last for a while.

