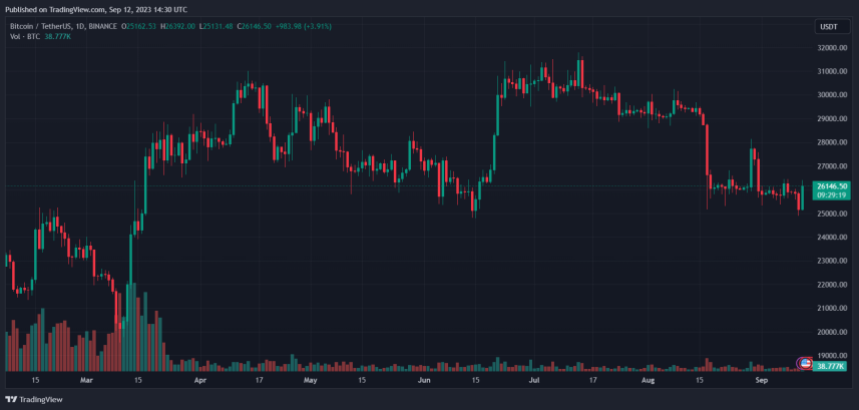
The Bitcoin price has been moving sideways over the past few weeks, although it saw a volatility spike in the last 24 hours. However, the cryptocurrency remains stuck as sentiment turns negative, and more and more traders expect another re-test of critical support.
As of this writing, Bitcoin (BTC) trades at $26,200 with a 3% profit in 24 hours. The cryptocurrency recorded a 2% profit the previous week and was the best performer in the crypto top 10 by market capitalization.

Why Is The Bitcoin Price Likely To Re-Test Critical Support
According to trading desk QCP Capital, the crypto market is about to enter its final quarter with a large option expiration event set for September 29th. These events are often a source of high volatility as major players hedge their positions, roll out contracts for future expiration dates, etc.
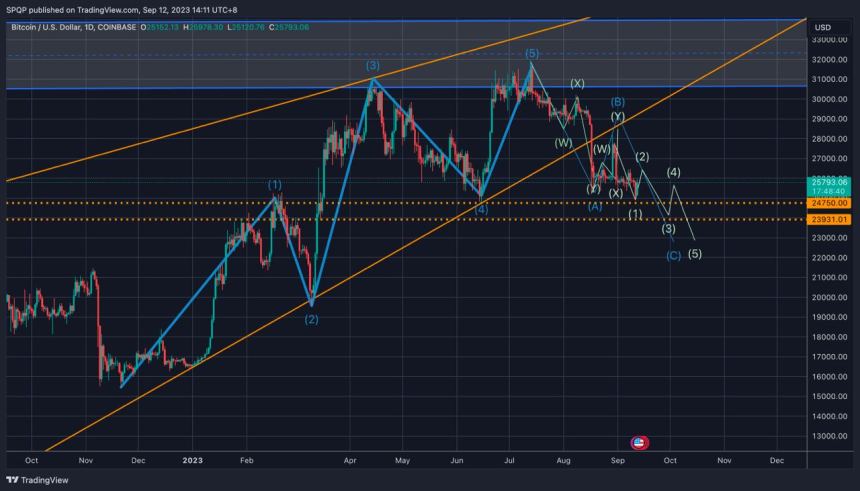
In addition, the trading desk points to late September as days with a lot of confluence between macroeconomic forces and their Elliot Wave count, signaling bearish price action. The Elliot Wave indicator attempts to provide a price trajectory for an asset by considering market psychology and investor sentiment.
QCP Capital believes that Bitcoin is moving and will likely correct into the $23,000 area to complete the trajectory corresponding with a Wave B, per the Elliot Wave theory. The crypto trading desk stated:
Based on both blueprints, we expect an imminent final decline to close out the quarter at the lows (Chart below). The crypto and macro events calendar also lines up with this view, with a concentration of upcoming bearish events that only turn neutral from mid-October onwards. This includes a likely higher-than-expected CPI tomorrow and a more-hawkish-than-expected FOMC next week (…)

Moreover, other bearish factors coincide with this potential bearish price action, such as the Mt. Gox Bitcoin unlock and the event surrounding the failed crypto exchange FTX. The bearish trajectory, QCP Capital argues, could prolonged into mid-October this year.
If the BTC price completes this trajectory, then the market would have hit bottom, and Bitcoin could begin to recover from a long winter. For late 2023 and 2024, the trading desk is more optimistic:
(…) while our theory implies a bottom soon after the supermoon early next month, we think the true bottom will come in mid-late October when the bad news cycle has run its course. We nonetheless remain bullish following that, into year-end and Q1 next year.
Cover image from Unsplash, chart from QCP Capital and Tradingview
