On-chain data shows the Bitcoin open interest has been slowly growing recently, something that could lead to more volatility in the price of the crypto.
Bitcoin Open Interest Goes Up While Funding Rates Approach A Neutral Value
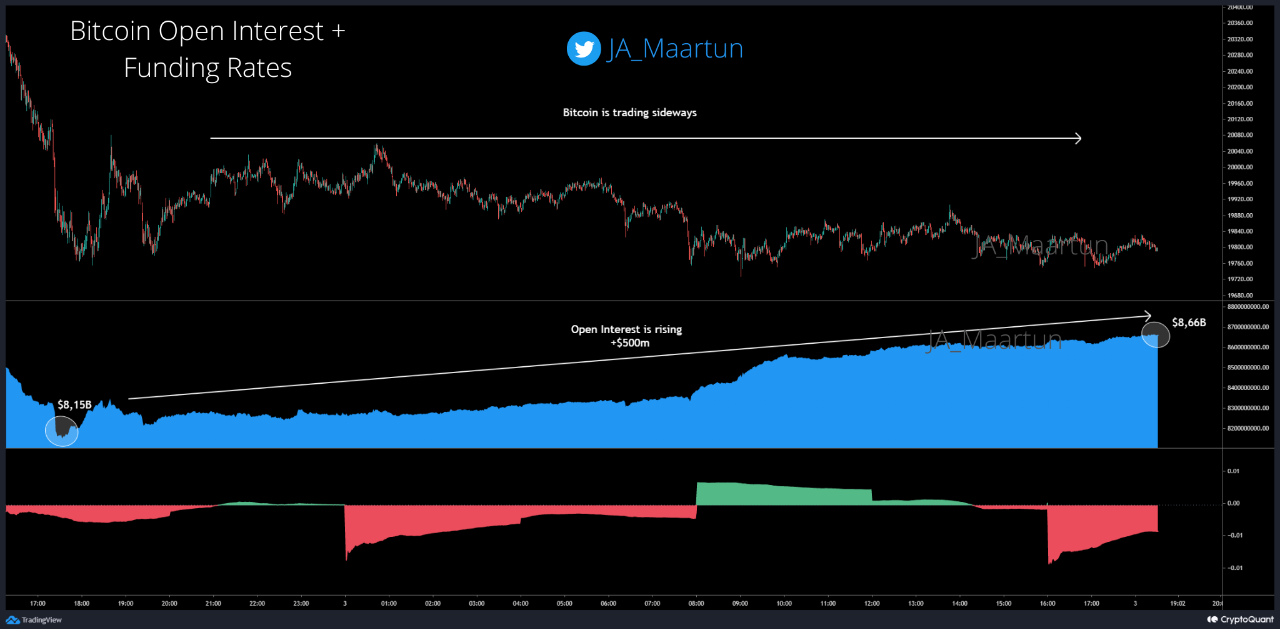
As pointed out by an analyst in a CryptoQuant post, the BTC open interest has gained around $500 million over the last few days.
The “open interest” is an indicator that measures the total amount of BTCUSD positions currently open on all derivatives exchanges. The metric takes into account for both short and long positions.
When the value of this indicator goes up, it means investors are opening up more positions on exchanges right now. Since this usually leads to a higher amount of leverage in the market, this kind of trend can make the price of Bitcoin more volatile.
On the other hand, the decline in the metric implies positions are closing up or liquidating on exchanges at the moment. Lower leverage usually leads to a more stable value of the crypto, and so such a trend can result in lesser volatility for BTC.
Now, here is a chart that shows the trend in the Bitcoin open interest over the last few days:

The value of the metric seems to have climbed up in recent days | Source: CryptoQuant
As you can see in the above graph, the Bitcoin open interest has observed an uplift during the past couple of days.
This increase amounted to around $500 million and took the indicator’s value from $8.15 billion to $8.66 billion.
The chart also includes data for the “funding rates,” a metric that tells us about the distribution of BTC positions between longs and shorts.
This indicator has most recently had a slightly negative value, which means the market is slightly leaning towards a short-dominant environment right now.
In times of high open interest (and hence high leverage), the market becomes more prone to seeing largescale liquidation events. Such liquidations are the reason behind the increased volatility of the market during such periods.
BTC has been mostly moving sideways during the last few days, but since the open interest has jumped up now, it’s possible the crypto could see fresh movement soon.
The funding rates can hint at which direction this new price volatility may favor, but since the metric’s value is almost neutral currently, it’s hard to say anything.
At the time of writing, Bitcoin’s price floats around $19.7k, down 1% in the past week.

BTC has continued to consolidate sideways during the past week or so | Source: BTCUSD on TradingView
Featured image from Kanchanara on Unsplash.com, charts from TradingView.com, CryptoQuant.com
