Data shows while Bitcoin has been correlated with the US stock market for some time now, the two haven’t moved in tandem recently.
Bitcoin Correlation With US Stocks May Be Weakening As BTC Has Been Moving Differently
As pointed out by an analyst in a CryptoQuant post, BTC has gone down in the past week while stocks have made some gains.
A “correlation” between two assets (or markets) exists when both their prices follow the same general trend over a period of time.
For Bitcoin, there has been a strong correlation with the US stock market during the last couple of years or so. The reason behind the markets becoming so tied is the rise of institutional investors in the crypto.
Such investors view BTC as a risk asset and pull out of the coin as soon as there is macro uncertainty looming over the market (hence driving the crypto’s price down along with the stocks).
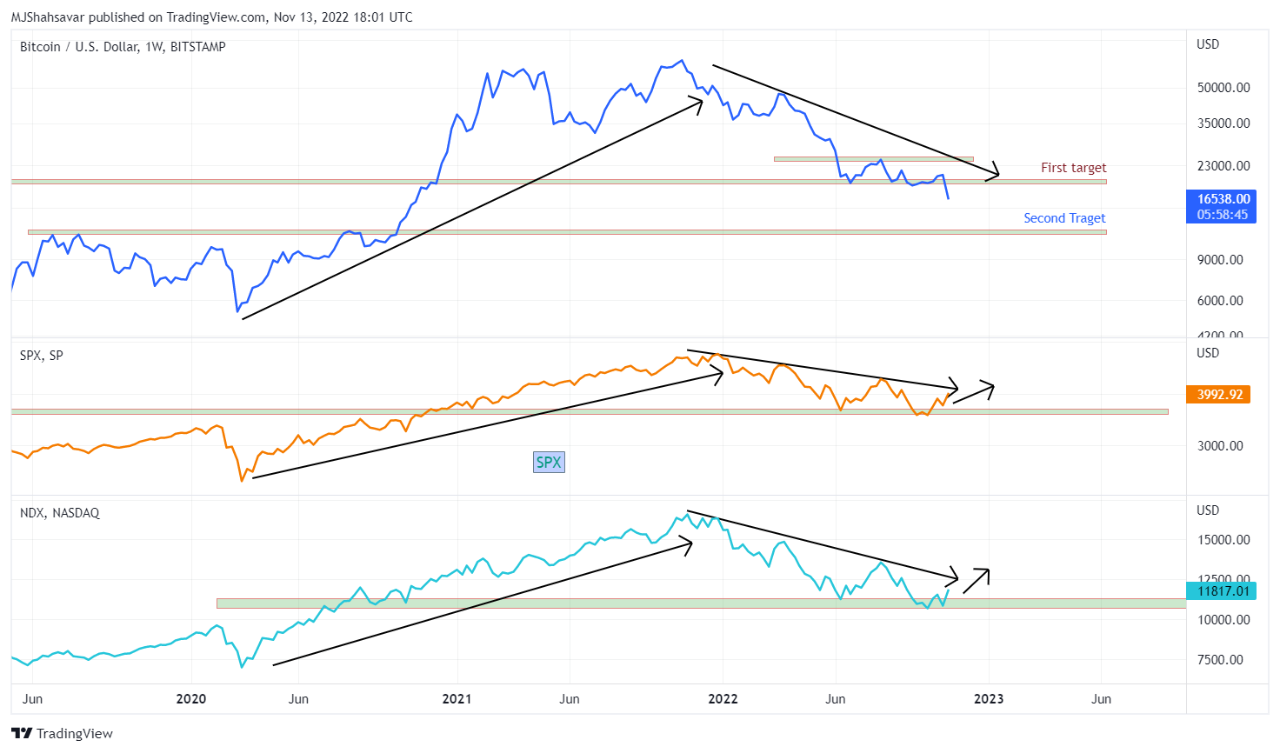
Here is a chart that shows the prices of Bitcoin, S&P 500, and NASDAQ over the last few years:

Looks like the assets have followed similar trends in recent times | Source: CryptoQuant
As you can see in the above graph, Bitcoin wasn’t correlated with the stock market in 2019 and early 2020, but it all changed when COVID struck.
After the black swan crash that occurred in March 2020, the price of BTC started following S&P 500 and NASDAQ.
Though, while BTC showed a same general long-term trend, the crypto continued to be much more highly volatile than the stocks.
The correlation has continued through the bear market, but the last week or so has turned out different.
While the US stock market has seen some uplift in the past 7 days, Bitcoin has instead taken a sharp plummet.
These markets showing different behavior recently could suggest the correlation between them may be reducing.
With the latest plunge, BTC has also lost the support line of the previous all-time high, something that has never happened in the previous cycles.
The quant in the post notes that this recent trend is a sign of weakness in the crypto market, which could lead to further downtrend in the near future.
BTC Price
At the time of writing, Bitcoin’s price floats around $16.5k, down 20% in the last week. Over the past month, the crypto has lost 15% in value.
The below chart shows the trend in the price of the coin over the last five days.

The value of the crypto seems to have remained below $17k in recent days | Source: BTCUSD on TradingView
Featured image from André François McKenzie on Unsplash.com, charts from TradingView.com, CryptoQuant.com
