On October 3, the Bitcoin hash rate soared to a new all-time high of 244.25 EH/s. Commenting on this, Binance CEO Changpeng Zhao said, “miners know something we don’t.”
Two days later, the hash rate surged yet again, smashing the previous record to print a new all-time high of 314.58 EH/s, further signaling miner confidence despite growing price uncertainty amid crypto winter.
Meanwhile, since the November 2021 market top, mining difficulty has also increased but not to the same magnitude seen in hash rate increases – all of which squeezes the miners’ bottom line.
The situation is further compounded by Bitcoin continuing to trade at relatively low prices.
Bitcoin Mining Revenue slumps
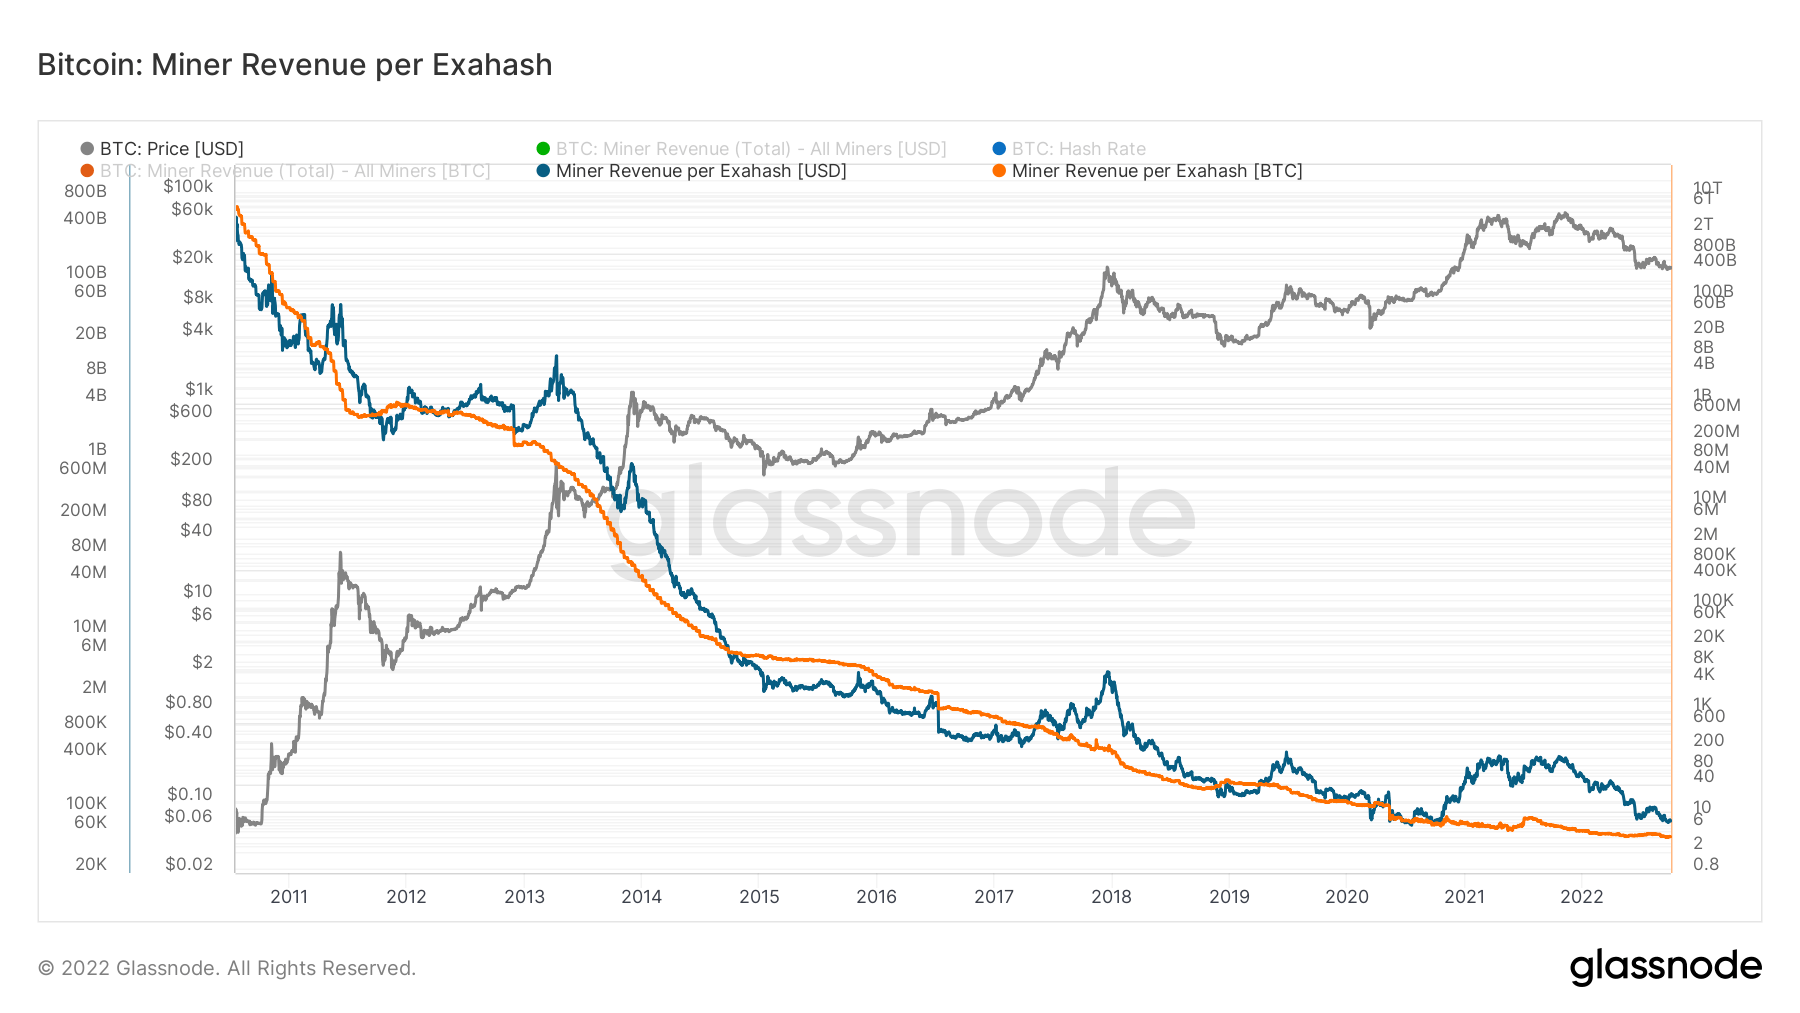
The Miner Revenue per Exahash chart below shows a steady long-term downtrend in revenue in both dollar and BTC terms.
Currently, BTC-denominated rewards come in as low as four BTC per day. This equates to around $80,000 a day in revenue per exahash, which is on par with revenues seen in late 2020 when Bitcoin was around $10,000.
Meanwhile, mining difficulty has increased alongside the hash rate, meaning it’s now more demanding and competitive to mine BTC profitably than ever before.

Hash Ribbons
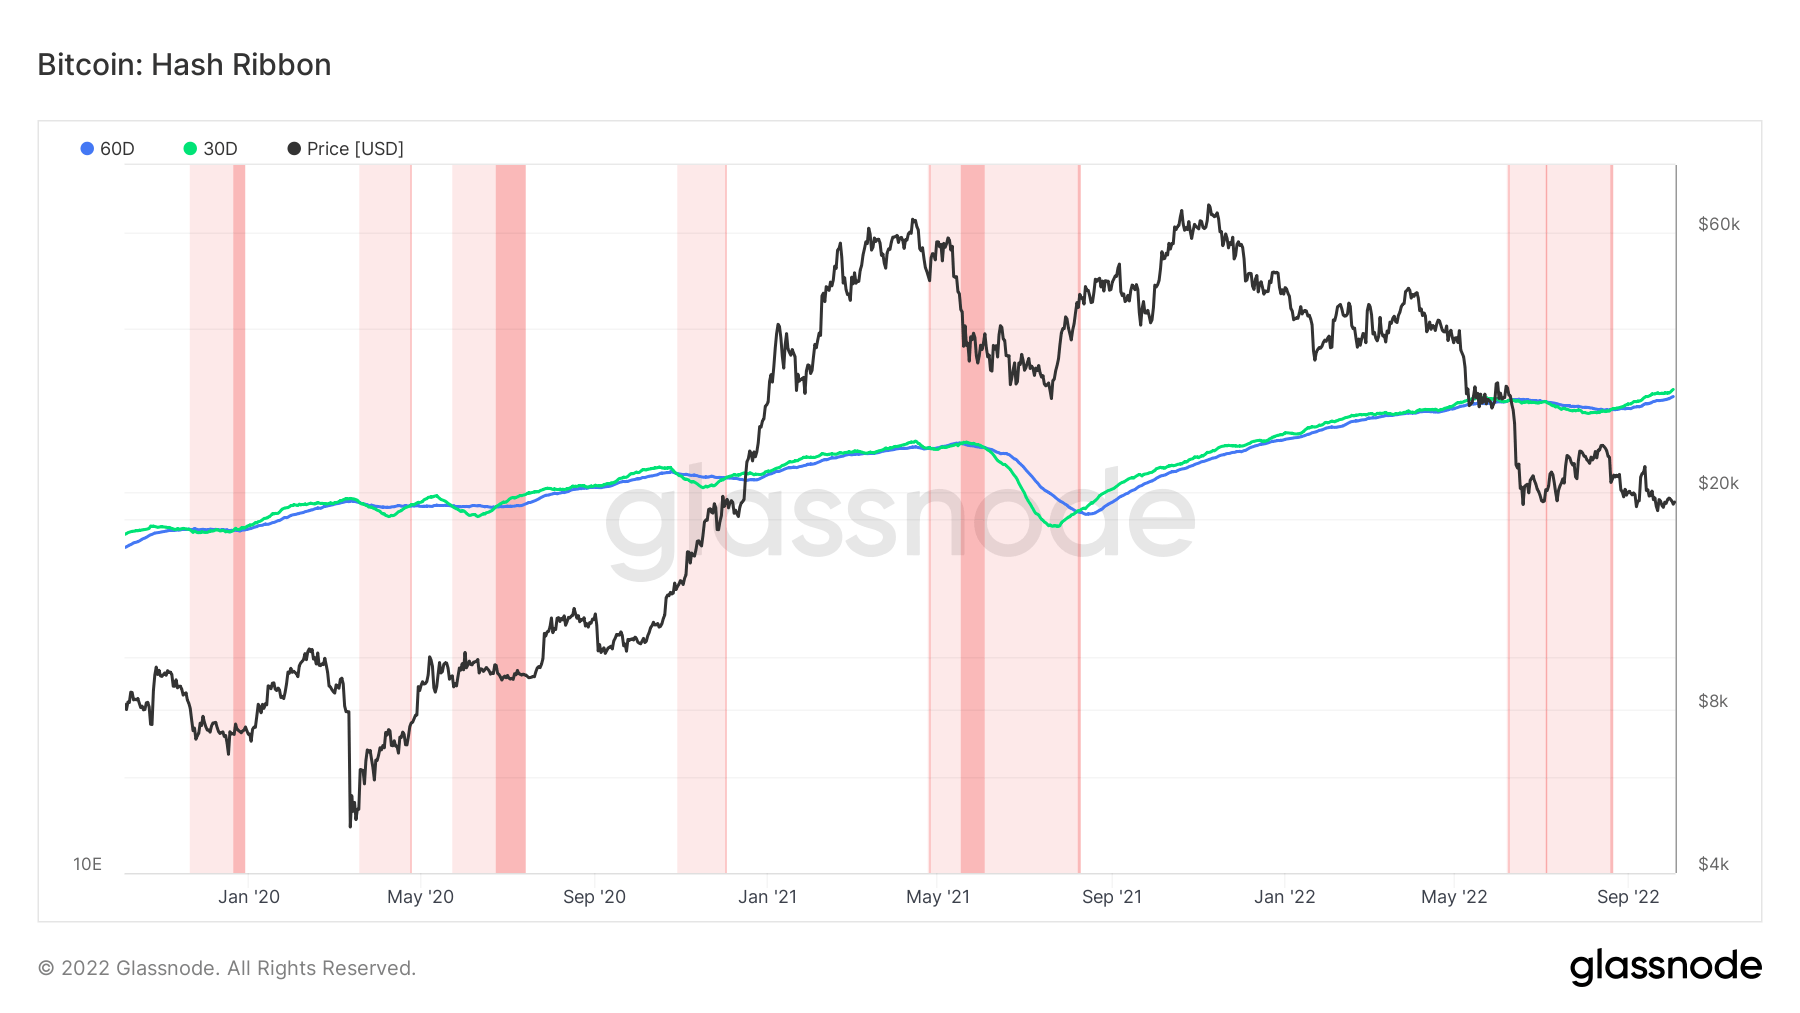
Hash Ribbons are calculated from the 30-day and 60-day Simple Moving Averages (SMA) of the Bitcoin hash rate. Analysts use this metric to determine periods of miners’ distress and thus can be used to predict capitulation.
The chart below shows the market has left a two-month-long capitulation period that ended around September. The capitulation period may have been a factor in Bitcoin’s continual drop below and subsequent recapture of the $20,000 level on numerous occasions in recent weeks.
During late August, the 30-day SMA crossed above the 60-day SMA, which saw an uptick in hash rate. When this phenomenon occurs, the price usually tends to rise, as seen during BTC’s run to $69,000 in November 2021.
However, aside from a rally between September 7-11, the BTC price did not sustain an uptrend this time round.

Miner Net Position Change
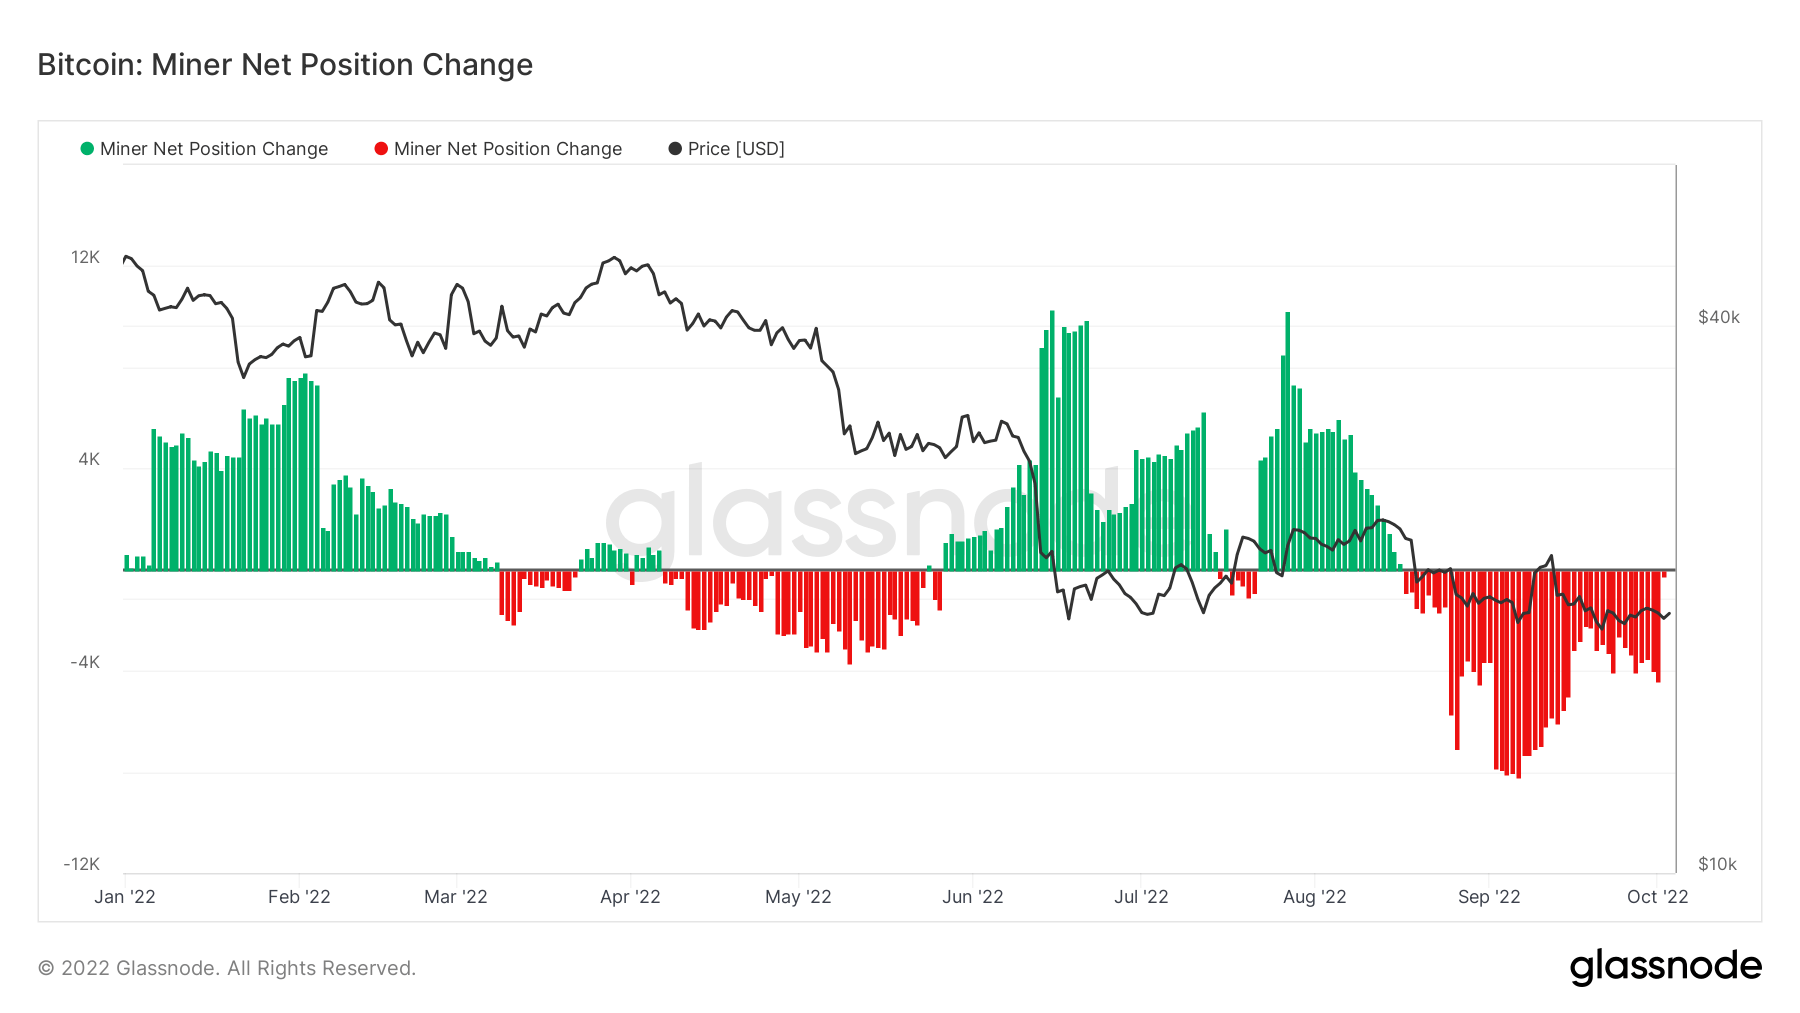
Miner Net Position change refers to the 30-day rate of change in Bitcoin miners’ unspent supply. Net positive readings equate to miners holding onto tokens, whereas net negative is when miners sell into the market.
The chart below shows a net negative distribution of tokens since mid-August. During September peaks, selling hit as high as -9,000.
Since then, there has been a noticeable drop-off in distribution with a current net position change of -4,500.


