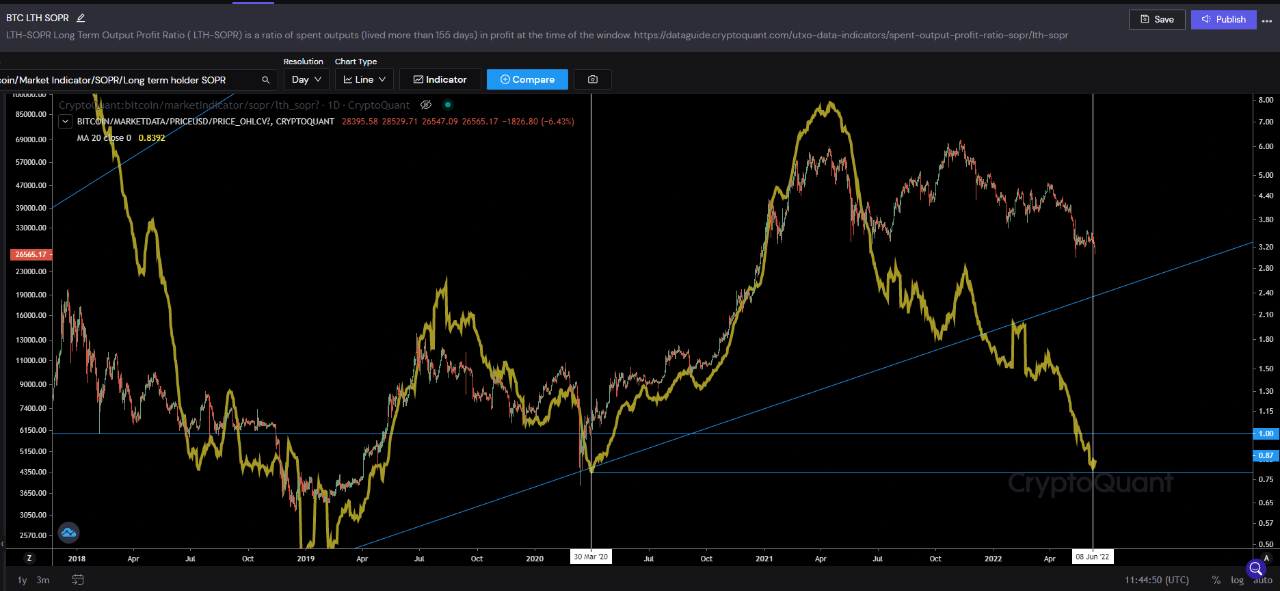
On-chain data shows the Bitcoin long-term holder SOPR has dropped to March 2020 levels as the price of the crypto crashes below $24k.
Bitcoin Long-Term Holder SOPR Plunges Deeper Below One
As pointed out by an analyst in a CryptoQuant post, BTC long-term holders are now realizing a similar level of loss as during March 2020.
The “spent output profit ratio” (or SOPR in brief) is an indicator that tells us whether Bitcoin investors are selling at a profit or at a loss right now.
The metric works by looking at the on-chain history of each coin being sold to see what price it was previously moved at.
If this last price was less than the current value of the crypto, then that particular coin has now been sold at a profit.
Related Reading | Bitcoin Slides As CPI Report Hints At Soaring Inflation – More Bearish Pressure Ahead?
On the other hand, the previous selling value being more than the latest price would imply the coin realized a loss.
When the value of SOPR is greater than one, it means the overall BTC market is selling at a profit at the moment. Values less than one, on the contrary, imply that investors as a whole are realizing losses right now.
“Long-term holders” (LTHs) are those Bitcoin investors who hold their coins for at least 155 days without selling them.
Here is a chart that shows the trend in the BTC SOPR specifically for these LTHs:

The value of the 20-day MA LTH SOPR looks to have plunged down recently | Source: CryptoQuant
As you can see in the above graph, the Bitcoin long-term holder SOPR dropped below one in value just a while ago, showing that LTHs have been selling at a loss recently.
The degree of LTH loss realization right now is the same as it was back in March 2020, following the crash due to COVID-19. The crypto also hit a bottom around then.
Related Reading | Head To Head: Bitcoin, Ethereum Profitability For Investors
The long-term holders now suffering from similar pain as back then may suggest that the market may soon see a bottom this time as well.
BTC Price
At the time of writing, Bitcoin’s price floats around $23.5k, down 24% in the last seven days. Over the past month, the crypto has lost 19% in value.
The below chart shows the trend in the price of the coin over the last five days.

Looks like the value of the crypto has crashed down over the last couple of days | Source: BTCUSD on TradingView
Today, Bitcoin plummeted below the $24k mark for the first time since December 2020, over 18 months ago. Currently, it’s unclear whether the crash has passed or if the coin will decline further still.
Featured image from Unsplash.com, charts from TradingView.com, CryptoQaunt.com
