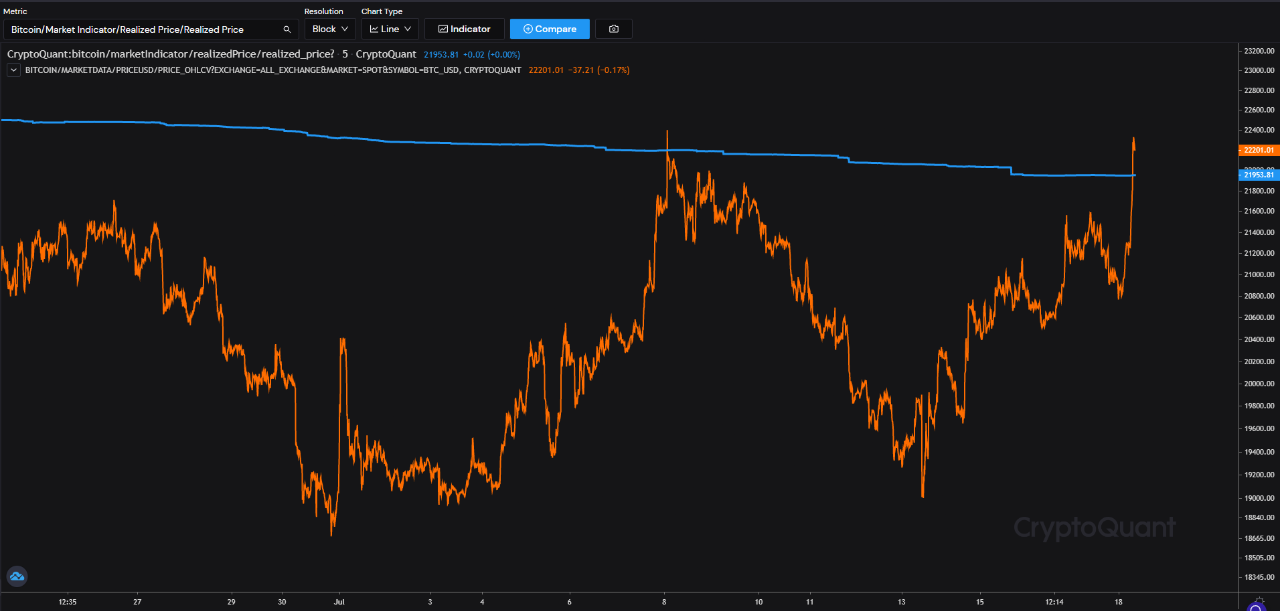
Data shows Bitcoin has broken above the realized price once again as the crypto surges to $22k. Will the recovery hold this time?
Bitcoin Makes 2nd Attempt To Break Above Realized Price In 10 Days
As pointed out by an analyst in a CryptoQuant post, BTC may be finally shooting above the realized price again after spending 33 days below the level in total.
To understand what the “realized price” is, it’s best to first take a look at a quick explanation of the two main capitalization methods for Bitcoin.
The “market cap” is calculated by multiplying each coin in circulation right now with the current BTC price, and taking the total sum (or more simply, it’s just the total number of coins multiplied by the price).
Where the “realized cap” differs is that, instead of taking the same one price for all, it rather weighs each coin against the value of BTC at which the particular coin was last moved/sold.
Related Reading | Bitcoin Bearish Signal: Exchange Netflows Spike Up
For example, suppose the current Bitcoin price is $22k and there are two coins in circulation. If one of these last moved at $22k while the other at $15k, then the market cap will be $44k, but the realized cap will be $37k.
Now, the realized price is measured by just dividing the realized cap by the total number of coins in circulation. The below chart shows the trend in this metric over the past month:

Looks like the BTC price is crossing over the metric's line | Source: CryptoQuant
As you can see in the above graph, the value of Bitcoin very briefly spiked above the realized price around ten days ago, before slamming down again,
Historically, late stage bear markets have lasted while the price of the crypto has remained below the metric’s line, with it acting as resistance.
Related Reading | Bitcoin Funding Rate Turns Highly Positive, Long Squeeze In The Making?
Today, BTC has once again shot up above the realized price curve, but it’s yet to be seen whether this time the recovery will last. If it does, then it could mean the bear bottom for the current cycle might be in.
Ignoring the brief spikes above the level, Bitcoin has now spent 33 days under the realized price so far. During 2015, the crypto was 9 months under this level, while in 2018 it was for a quarter of a year.
BTC Price
At the time of writing, Bitcoin’s price floats around $22k, up 8% in the last seven days. Over the past month, the crypto has gained 8% in value.

The price of the coin seems to have surged up over the past day | Source: BTCUSD on TradingView
Featured image from Maxim Hopman on Unsplash.com, charts from TradingView.com, CryptoQuant.com
