On-chain data shows that Ethereum traders are capitulating following the slowdown of the rally, something that may turn out to be positive.
Ethereum Traders Are Selling At A Loss Right Now
According to data from the on-chain analytics firm Santiment, ETH investors are getting increasingly frustrated as they are now participating in significant loss-taking.
The relevant indicator here is the “ratio of daily on-chain transaction volume in profit to loss,” which, as its name already implies, compares the profit-taking volume to the loss-taking volume for any given cryptocurrency.
This metric works by going through the on-chain history of each coin being sold/transferred to see the price at which it was previously moved. If this last selling price for any coin was less than the current spot price, then that particular token is now being sold at a profit.
Naturally, the sale of this coin would count under the profit-taking volume. Similarly, the opposite type of coins would contribute towards the loss-taking volume.
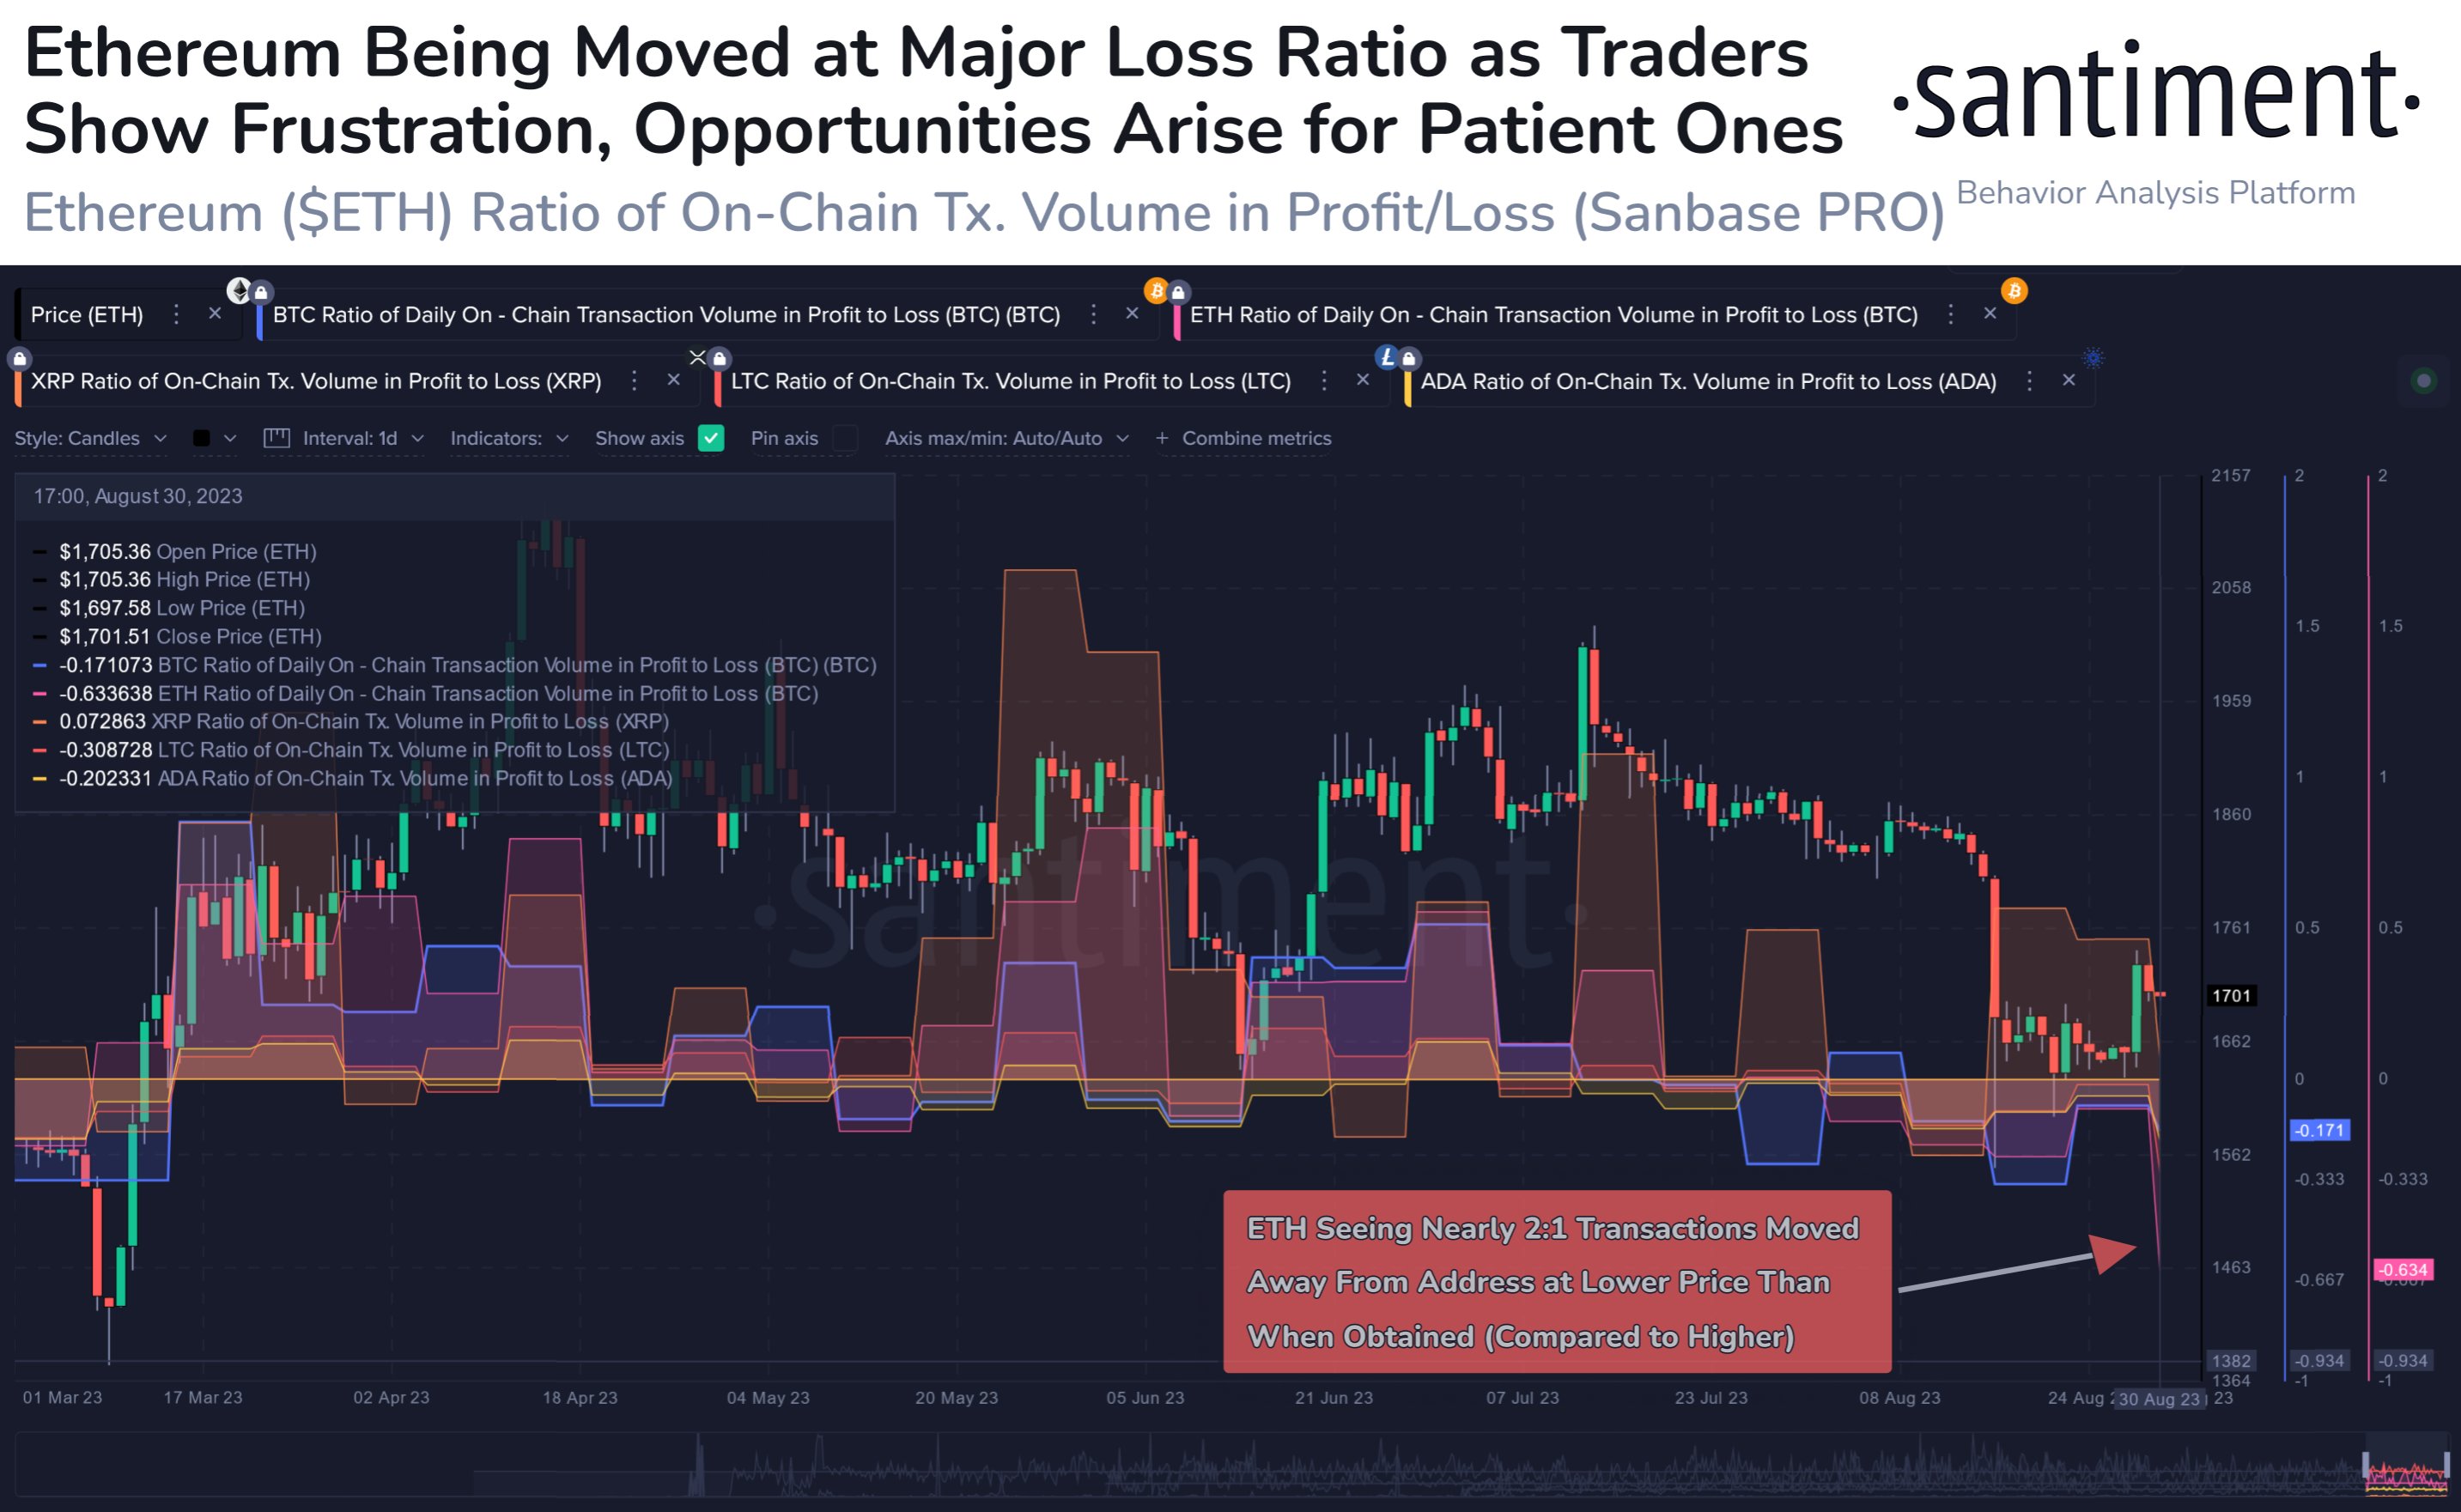
Now, here is a chart that shows the trend in this ratio for some of the top assets in the cryptocurrency sector over the past few months:
Looks like the value of the metric has been negative for most of these coins in recent days | Source: Santiment on X
When the value of this metric is positive, it means that the profit-taking volume outweighs the loss-taking volume right now. On the other hand, negative values suggest the dominance of loss-taking in the market.
From the chart, it’s visible that many of these top assets have seen negative values of the indicator recently as the rally that began following the Grayscale news has slowed down.
Ethereum, however, stands out among these coins as the indicator’s value for the asset is significantly more negative than the likes of Bitcoin and Cardano, who are observing loss-taking volumes that are only mildly more than the profit-taking ones.
At the metric’s current value, the Ethereum investors are making loss-taking transactions at a rate nearly double that of the profit-taking ones. This difference between ETH and the other top assets would suggest that the coin traders are showing the least amount of patience.
This could be because they don’t think the cryptocurrency would continue its rally anymore, or if it does, the profits wouldn’t be as large as for some of the other altcoins, so they may be exiting here at losses to go to greener pastures.
This high amount of loss-taking could, however, actually turn out to be beneficial for Ethereum. Historically, whenever investors have participated in capitulation, rebounds in the price have become more probable.
The likely explanation behind this pattern may be the fact that investors pick up the coins that these relatively weak hands sell with a stronger conviction, who provide a better foundation for a sustainable price surge.
It remains to be seen whether Ethereum can use this capitulation to bounce off towards higher levels or if the rally will remain muted for a while longer.
ETH Price
At the time of writing, Ethereum is trading around $1,700, up 3% in the last week.
ETH has been moving sideways since the surge | Source: ETHUSD on TradingView
Featured image from Kanchanara on Unsplash.com, charts from TradingView.com, Santiment.net

