On-chain data shows the Ethereum supply on exchanges has continued to drop lower recently, a sign that could be bullish for the asset.
Ethereum Supply On Exchanges Has Gone Down Recently
According to data from the on-chain analytics firm Santiment, supply has continued to leave exchanges recently. The relevant indicator here is the “supply on exchanges,” which measures the total percentage of the Ethereum supply that’s sitting in the wallets of all centralized exchanges.
When the value of this metric increases, it means that a net number of coins is entering the supply of these platforms. As one of the main reasons why investors might want to deposit their ETH to the exchanges is for selling-related purposes, this kind of trend can have a bearish effect on the asset’s value.
On the other hand, decreasing values of the indicator imply the holders are withdrawing their coins from these platforms right now. Such a trend, when prolonged, may be a hint that the investors are accumulating currently, and hence, can be bullish for the cryptocurrency.
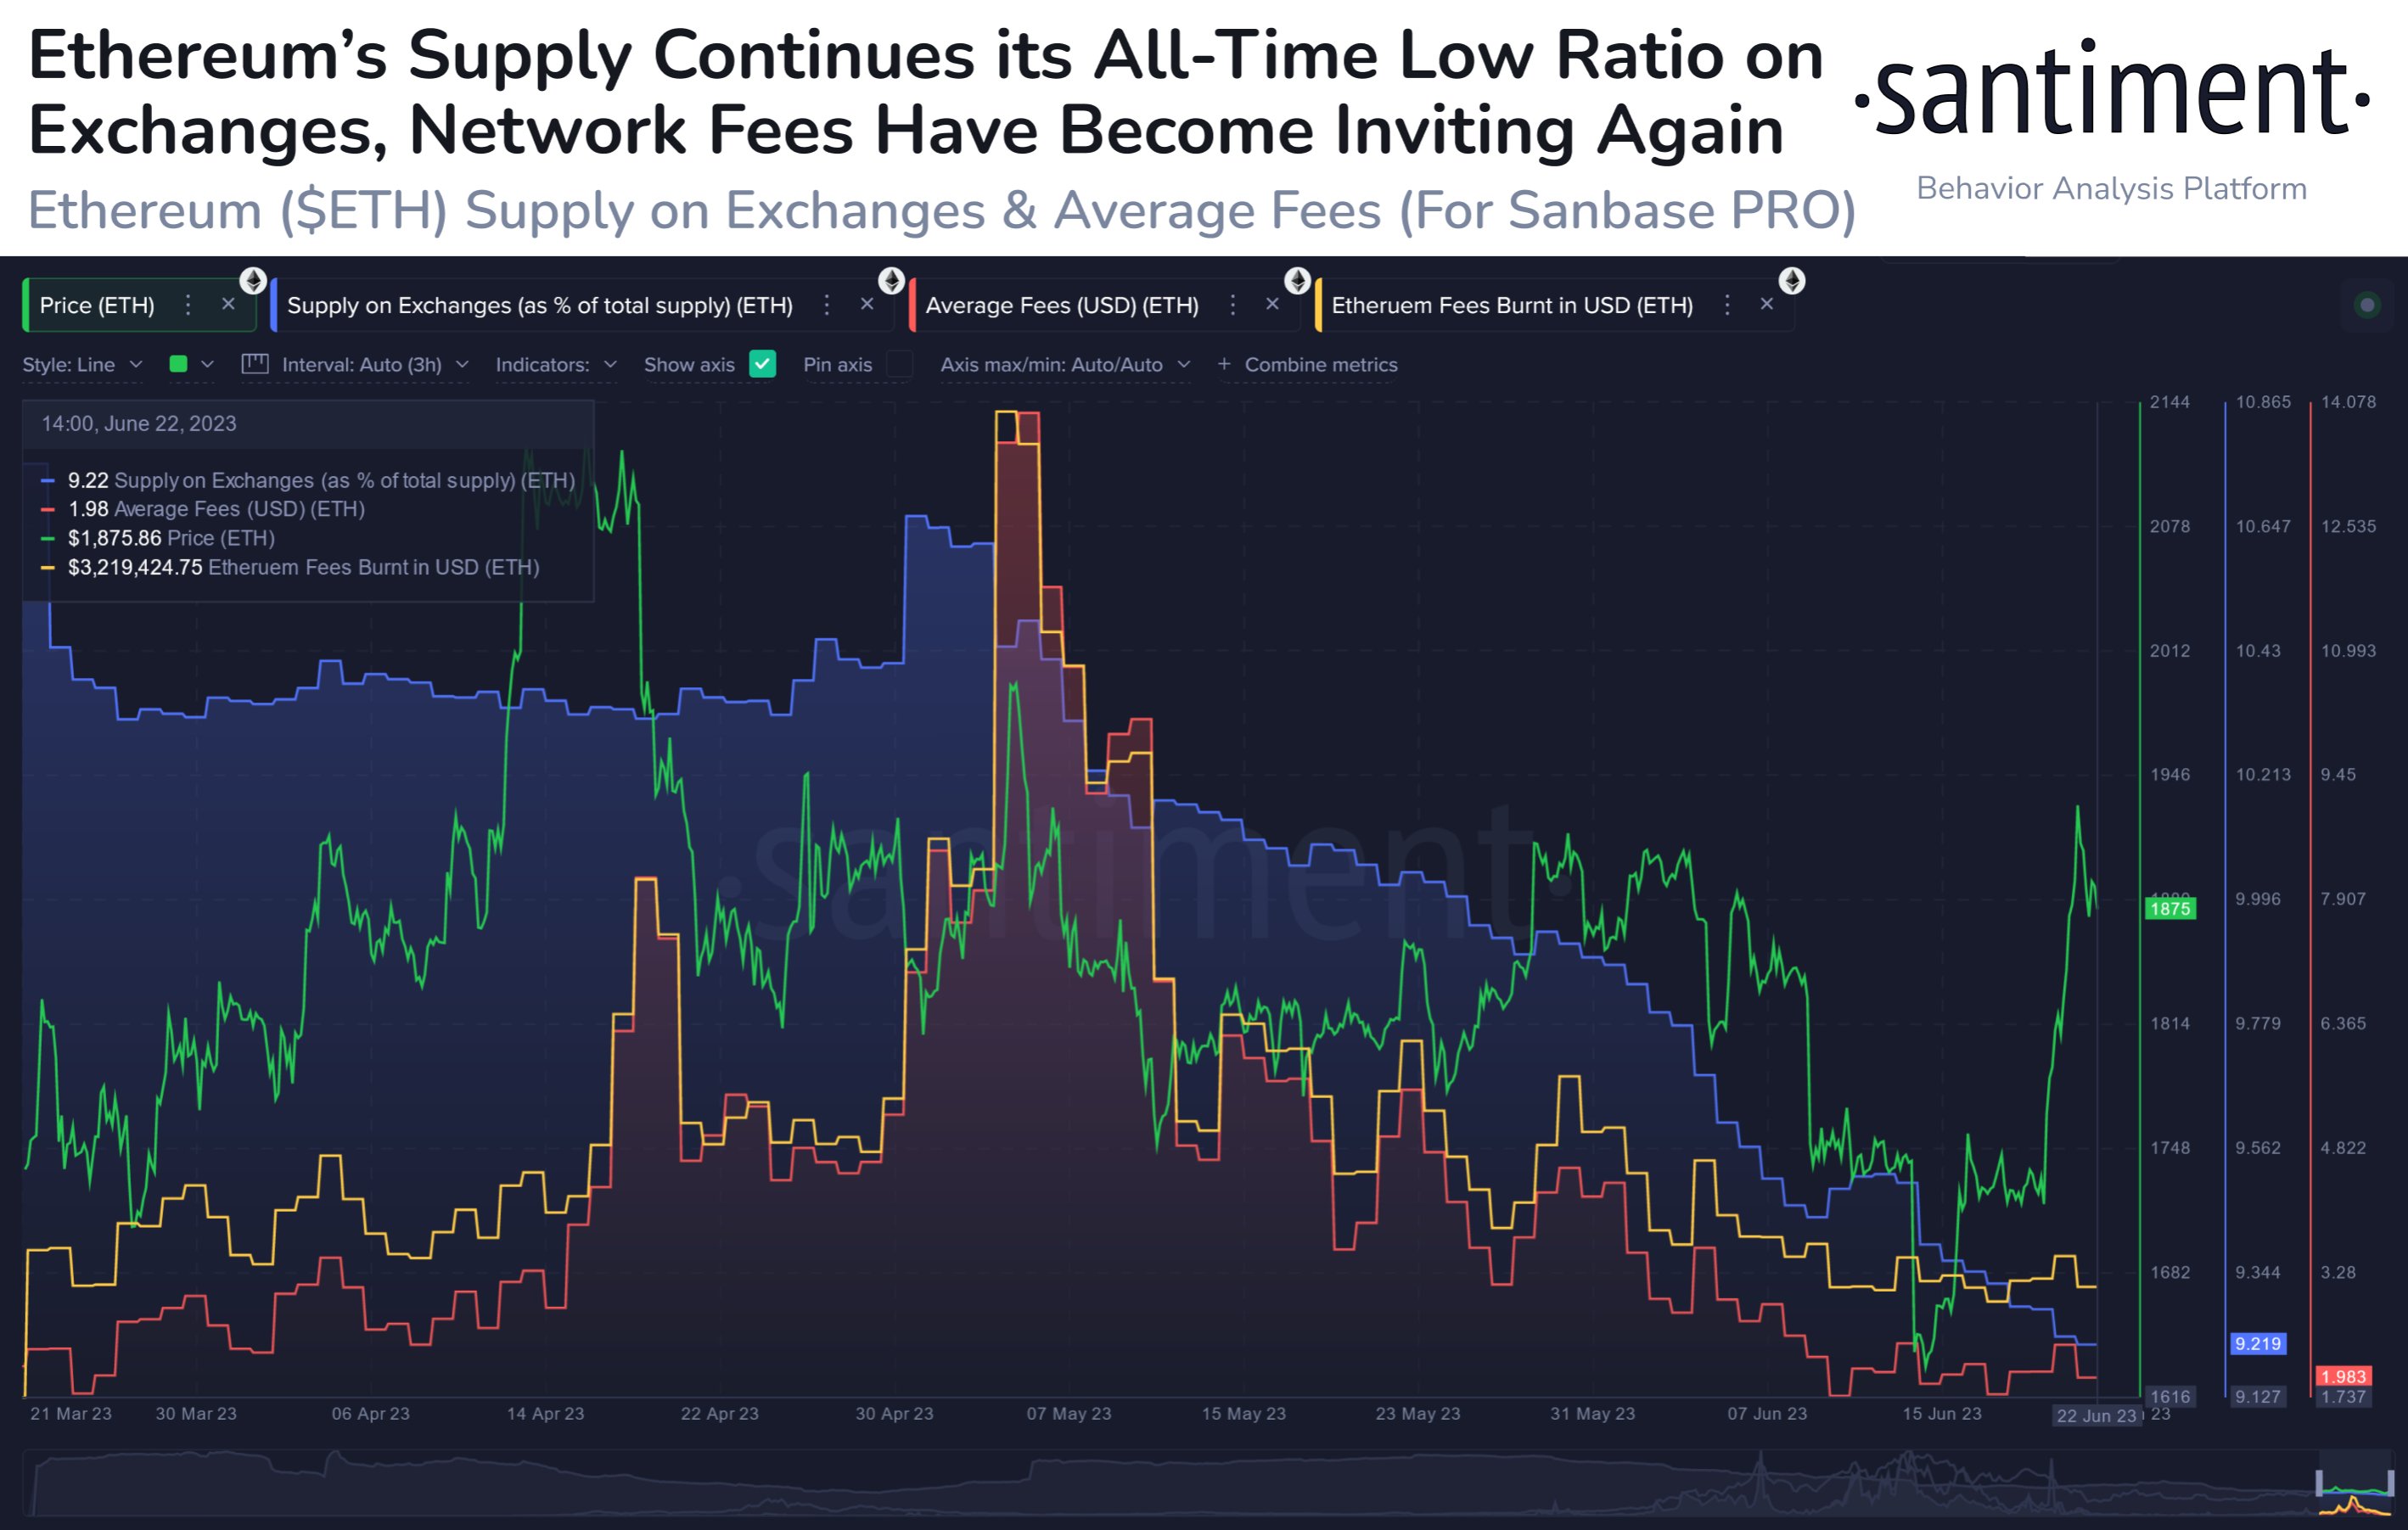
Now, here is a chart that shows the trend in the Ethereum supply on exchanges over the last few months:
The value of the metric seems to have been going down in recent days | Source: Santiment on Twitter
As displayed in the above graph, the Ethereum supply on exchanges has been in a downtrend during the last few weeks, implying that investors have been constantly taking out their coins from these platforms.
When these withdrawals started, the indicator had reached what was essentially an all-time low (the only time the metric’s value was lower was way back during the first week of the asset going live for public trading).
As the holders have continued to transfer their ETH out of the exchanges, new all-time lows in the metric have continued to be hit. Interestingly, even after the latest sharp rally in the Ethereum price has occurred, the metric hasn’t deviated from its downward trajectory.
Usually, during rapid increases in the asset’s value, the supply on exchanges tends to go up as some investors look to take advantage of the profit-taking opportunity.
Since the indicator has only continued to go down further recently, it’s possible that even if there is some selling going on, there is also enough buying going to make up for it.
In the chart, Santiment has also included the data for the “average fees,” an indicator that measures the average amount of fees that investors are attaching to their Ethereum transactions currently.
From the graph, it’s visible that this metric has been relatively low recently. It would appear that even though the rally has taken place, the network activity hasn’t yet exploded, as the fees generally shoot up when there is a high amount of traffic on the blockchain.
The analytics firm notes, however, that this setup is quite similar to that observed back in March, following which Ethereum saw a rapid rise toward the $2,100 level.
ETH Price
At the time of writing, Ethereum is trading around $1,800, up 12% in the last week.
Looks like the value of the asset has seen a sharp surge recently | Source: ETHUSD on TradingView
Featured image from DrawKit Illustrations on Unsplash.com, charts from TradingView.com, Santiment.net

