On-chain data shows Bitcoin funding rates have turned positive, suggesting there have been some fresh long openings on derivative exchanges.
Bitcoin Funding Rate Turns Green After Derivative Exchange Inflows Spike Up
As pointed out by an analyst in a CryptoQuant post, the new long positions can drive the price up in the short term.
There are mainly two Bitcoin indicators of relevance here, the derivative exchange inflow CDD, and the funding rates.
First, the “derivative exchange inflow CDD” is a metric that tells us whether old BTC supply is moving into derivative exchange wallets or not.
When the value of this metric spikes up, it means a large number of previously dormant coins are entering into these exchanges right now.
Since investors usually deposit their BTC to derivatives for opening up new positions on the futures market, this kind of trend can lead to higher volatility in the price of the crypto as a result of the increased leverage.
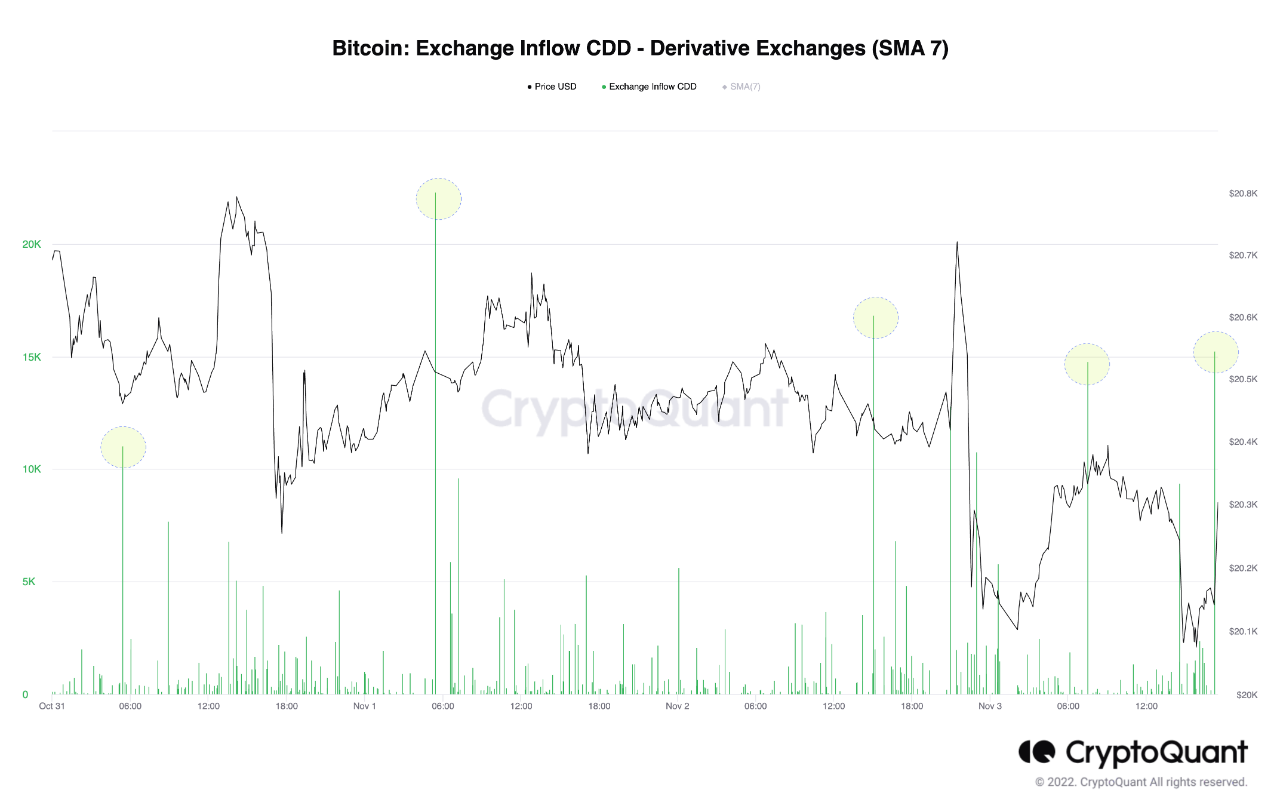
Now, here is a chart that shows the trend in the 7-day moving average Bitcoin derivative exchange inflow CDD over the past few days:

Looks like the 7-day MA value of the metric has spiked up recently | Source: CryptoQuant
As you can see in the above graph, the Bitcoin derivative exchange inflow CDD has spiked up over the past day, suggesting that some aged BTC supply has just been deposited into these platforms.
Dormant supply usually belongs to the most resolute holders in the market, so any movement from them can have noticeable impacts on the crypto.
The other metric of interest here is the “funding rate,” which measures the periodic fee being exchanged between traders on the futures market.
When this indicator has positive values, it means there are more long positions open than shorts right now. On the other hand, negative values imply shorts are overwhelming the longs at the moment.
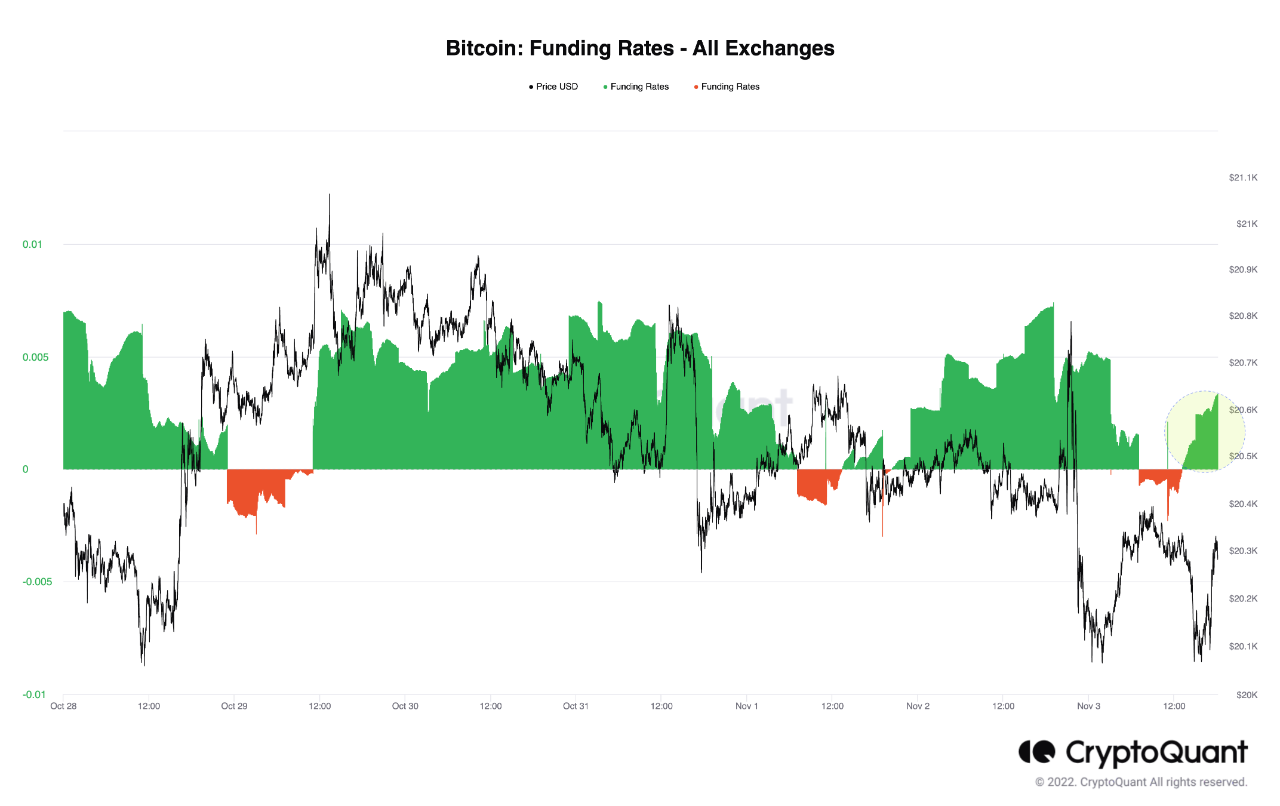
The below chart shows the recent trend in the Bitcoin funding rates.

The value of the metric has turned positive over the past day | Source: CryptoQuant
From the chart, it’s apparent that following the latest inflows, the funding rates have turned turned back to positive after being slightly negative yesterday.
This would suggest that the HODLers who transferred these coins have opened new long positions in the futures market.
The quant notes in the post that these fresh long positions could support Bitcoin in the short term.
BTC Price
At the time of writing, Bitcoin’s price floats around $20.5k, up 2% in the last week.

Looks like BTC has surged up a bit in the past day | Source: BTCUSD on TradingView
Featured image from Bastian Riccardi on Unsplash.com, charts from TradingView.com, CryptoQuant.com
