On-chain data shows the Bitcoin NUPL metric is back to a positive value, suggesting the market as a whole is back in profit.
Bitcoin NUPL Latest Trend Could Signal The Bottom Is Already In
As pointed out by an analyst in a CryptoQuant post, the BTC NUPL breaking above the neutral market may be a sign that the bottom has set in.
The “Net Unrealized Profit/Loss” (or “NUPL” in short) is an indicator that’s defined as the difference between the market and realized caps, divided by the market cap.
In simpler terms, what this metric tells us is the profit/loss ratio among investors in the current Bitcoin market.
The indicator works by looking at the on-chain history of each coin to see what price it was last moved at. If this selling price of any coin was less than the current BTC value, then that particular coin is holding some profit right now. Otherwise, it is in loss at the moment.
Related Reading | Capitulation: Public Bitcoin Miners Dump 25% of BTC Holdings Last Month
When the value of the NUPL is greater than zero, it means investors in the Bitcoin market as a whole are in profit. On the other hand, the indicator’s value being negative implies the overall market is currently in a state of loss.
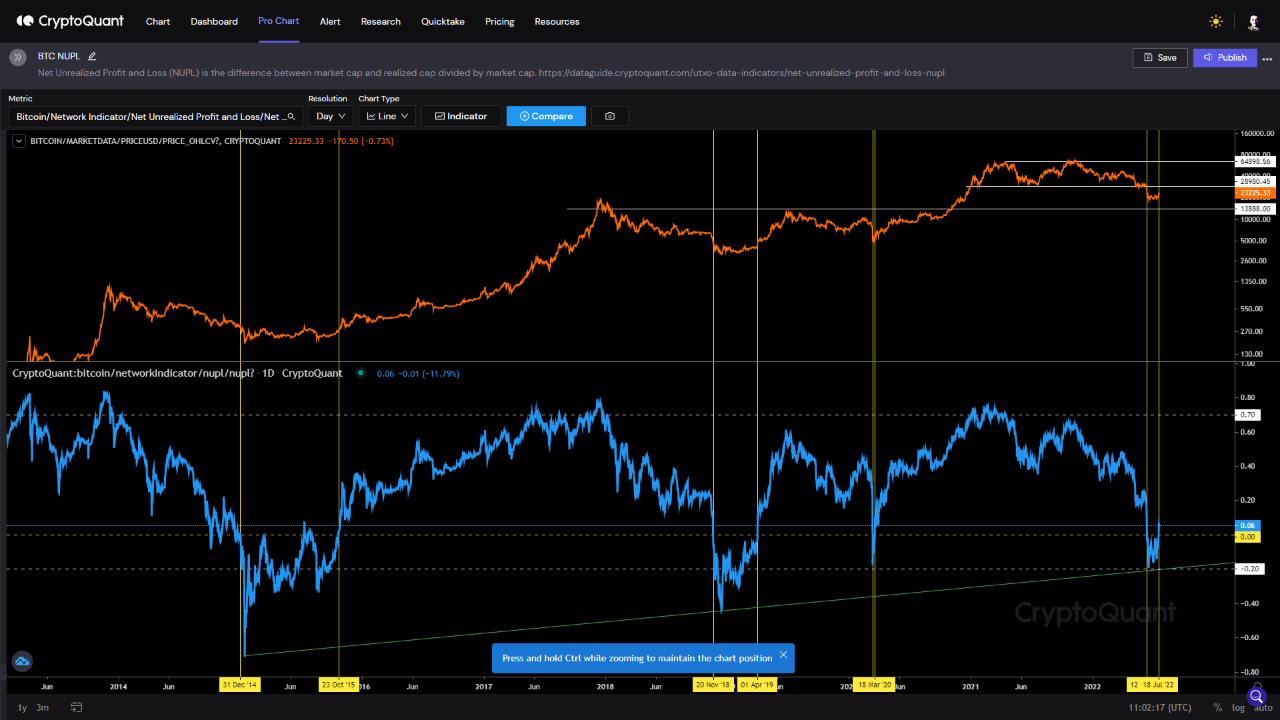
Now, here is a chart that shows the trend in the BTC NUPL over the last several years:

The value of the metric seems to have surged up in recent days | Source: CryptoQuant
As you can see in the above graph, the quant has marked the relevant zones of bear market trend for the Bitcoin NUPL.
It looks like some time after plunging deep below zero, a bounce back to positive values has been a sign of bottom formation during the previous bear markets.
Currently, the indicator is back to a positive value after observing a surge recently. This means that the investors as a whole are slightly in profit right now.
If the past cycles are anything to go by, this trend could imply the bottom has already been in for this Bitcoin bear market.
However, as is apparent in the chart, a break to green NUPL values doesn’t necessarily mean the end of the bear. It has only indicated that the crypto has already faced the worst.
Related Reading | Tesla Ruins Bitcoin Rally? Musk’s Company Sold 75% Of Its BTC
Past bear markets have lasted for much longer than the current one so it’s possible that if a similar pattern follows, the market may drop back into loss and move sideways for a while, before a proper bullish momentum builds up.
BTC Price
At the time of writing, Bitcoin’s price floats around $22.6k, up 10% in the past week.

BTC has slumped down during the last 24 hours | Source: BTCUSD on TradingView
Featured image from Kanchanara on Unsplash.com, charts from TradingView.com, CryptoQuant.com
