On-chain data shows the Bitcoin exchange whale ratio has been going up recently, something that may be bearish for the price of the crypto.
Bitcoin Exchange Whale Ratio Has Been Going Up In Recent Weeks
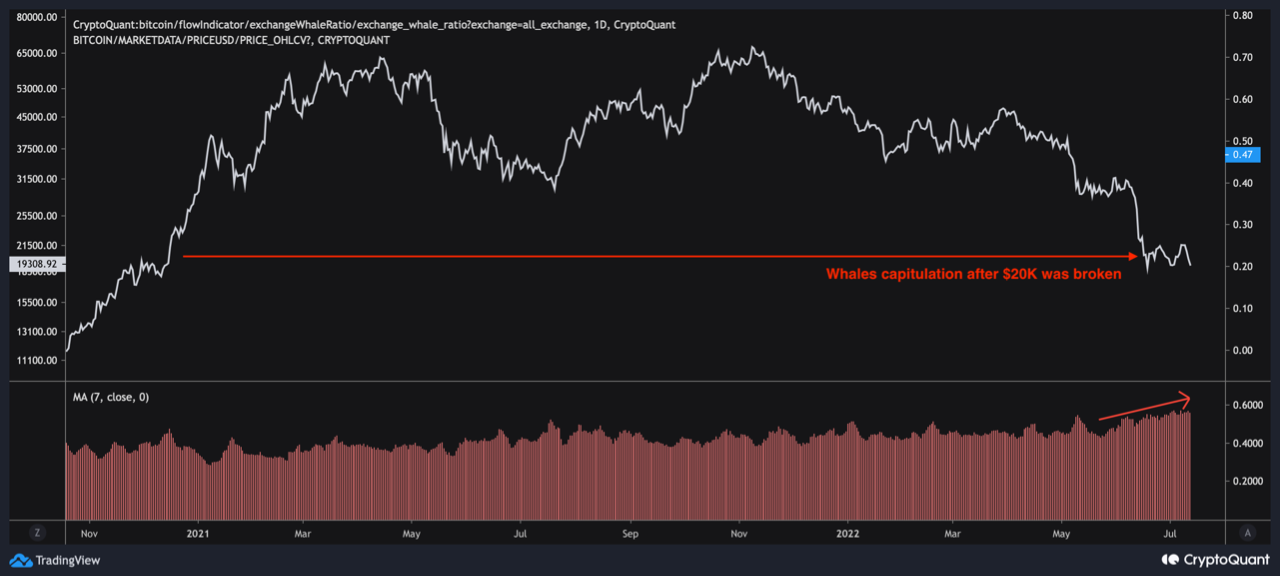
As pointed out by an analyst in a CryptoQuant post, the current BTC whale ratio value suggests whales are still selling large amounts.
The “exchange whale ratio” is an indicator that measures the ratio between the sum of the top ten Bitcoin transactions to exchanges and the total exchange inflows.
In simpler terms, what this metric tells is how much of the total inflows to exchanges is contributed by the whales (the ten largest transactions are assumed to be from whales).
When the value of the ratio is high, it means the whales are making up for a large part of the inflows right now. Such a trend can be a sign of dumping from these humongous holders, and hence can be bearish for the crypto.
Related Reading | Glassnode: Bitcoin LTHs Who Bought During 2017-2020 Aren’t Selling Yet
On the other hand, low values of the metric can suggest whales are selling at a healthy rate right now. This could be either neutral or bullish for BTC’s price.
Now, here is a chart that shows the trend in the Bitcoin exchange whale ratio over the last couple of years:

Looks like the value of the indicator has been going up recently | Source: CryptoQuant
As you can see in the above graph, the Bitcoin exchange whale ratio has been rising up in recent weeks.
The increase seems to have started around when the coin dropped below the $20k support. A large part of the market went underwater following this crash and the subsequent ramping up of dumping from whales could suggest they are in a capitulation phase right now.
Related Reading | Inflation Hits New 40-Year High, Will Bitcoin And Ethereum Plummet Again?
The quant notes that while this heavy selling from the whales can be bearish for the crypto’s price in the short term, it could also be a sign that the bottom is coming near.
BTC Price
At the time of writing, Bitcoin’s price floats around $19.4k, down 3% in the last seven days. Over the past month, the crypto has lost 27% in value.
The below chart shows the trend in the price of the coin over the last five days.

The value of the crypto seems to have been going down over the last few days | Source: BTCUSD on TradingView
Bitcoin looked to be holding above $20k a week ago or so, but during the past few days the coin has once again started moving down below the level.
Featured image from Karl-Heinz Müller on Unsplash.com, charts from TradingView.com, CryptoQuant.com
