On-chain data shows the Bitcoin exchange whale ratio has remained at a high value recently, a sign that could be bearish for the crypto’s price.
Bitcoin Exchange Whale Ratio On Verge Of Entering “Very High Risk” Zone
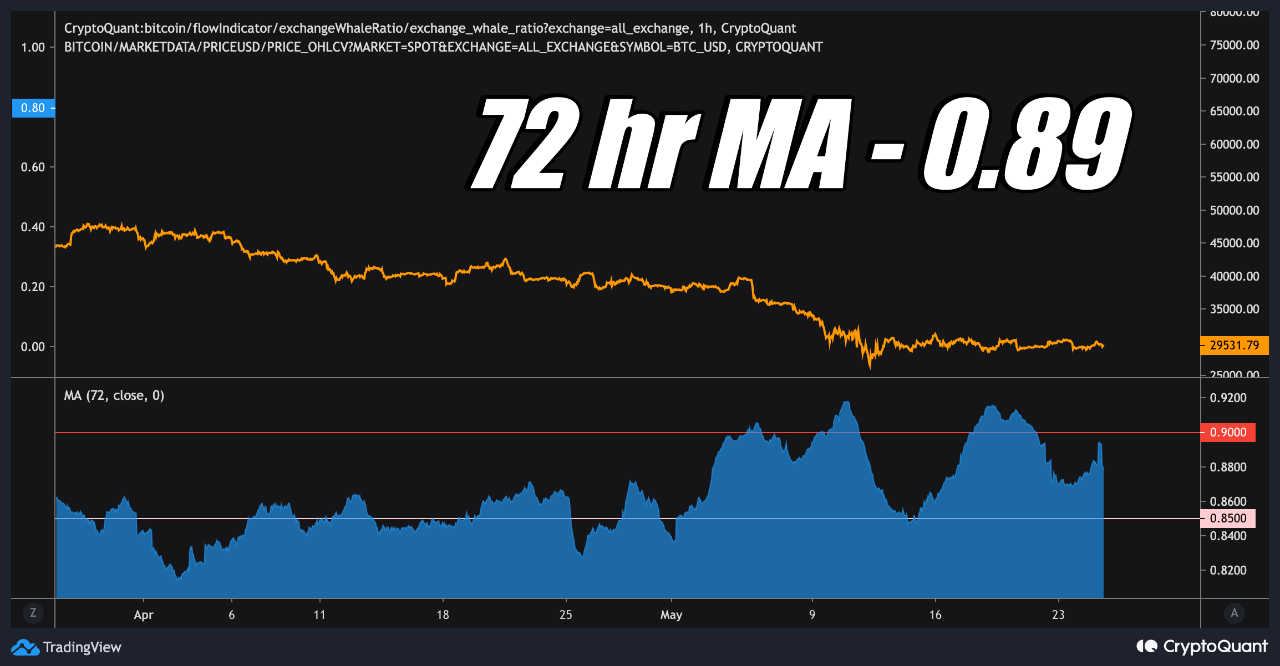
As explained by an analyst in a CryptoQuant post, the 72-hour MA whale ratio is near 0.90, the very high risk zone.
The “exchange whale ratio” is an indicator that’s defined as the sum of top ten inflows to exchanges divided by the total inflows.
In simpler terms, this metric tells us what part of the total inflows are contributed by the ten largest transactions, which typically belong to the whales.
When the value of this indicator is above 0.85, it means whales occupy a very large percentage of exchange inflows right now.
As investors usually transfer their Bitcoin to exchanges for selling purposes, such a trend can be a sign that whales are dumping at the moment.
The indicator’s value usually remains above this threshold during BTC bear markets, or fake bull for mass dumping.
Related Reading | Bitcoin Trading Volume Plummets Down From Recent Top
On the other hand, values below the 0.85 mark usually signify that whale inflows are currently in a healthier balance with the rest of the market. The ratio’s value usually remains in this region during bull runs.
Now, here is a chart that shows the trend in the Bitcoin exchange whale ratio (72-hour MA) over the past couple of months:

It looks like the indicator has been at a high value recently | Source: CryptoQuant
As you can see in the above graph, the Bitcoin exchange whale ratio has a value of about 0.89 right now, above the 0.85 threshold.
According to the quant in the post, values above 0.90 may be considered the “very high risk” zone. So, the current value of the indicator is very close to that.
Related Reading | Investors May Expect Downside For Bitcoin And Ethereum Market For The Next 3 Months
In this month so far, the ratio’s value has almost always remained above the 0.85 line, with a couple of spikes above the 0.90 level.
The analyst believes whales are active right now due to the FED May Meeting Minutes, and if the ratio remains high in the near future, then it could spell trouble for Bitcoin.
BTC Price
At the time of writing, Bitcoin’s price floats around $28.8k, down 2% in the last seven days. Over the past thirty days, the crypto has lost 30% in value.
The below chart shows the trend in the price of the coin over the last five days.

Seems like the price of the coin has plunged down over the last couple of days | Source: BTCUSD on TradingView
Featured image from Unsplash.com, charts from TradingView.com, CryptoQuant.com
