
Bitcoin failed again to clear the $41,500 resistance zone against the US Dollar. BTC could extend losses if there is a clear move below the $39,200 support zone.
- Bitcoin made another attempt to gain pace above the $41,500 level but failed.
- The price is now trading below $41,000 and the 100 hourly simple moving average.
- There was a break below a key bullish trend line with support near $40,400 on the hourly chart of the BTC/USD pair (data feed from Kraken).
- The pair could extend decline if there is a daily close below the $40,000 support zone.
Bitcoin Price Trims Gains
Bitcoin price corrected above the $41,000 resistance zone. BTC even cleared the $41,400 level and attempted a clear move above the $41,500 resistance zone.
However, the bears were active near the $41,500 level. A high was formed near $41,548 and the price started a fresh decline. There was a clear move below the $41,000 support zone. The price declined below the 50% Fib retracement level of the recent increase from the $39,269 swing low to $41,548 high.
Besides, there was a break below a key bullish trend line with support near $40,400 on the hourly chart of the BTC/USD pair. The pair is now trading below $41,000 and the 100 hourly simple moving average.
It also spiked below the 76.4% Fib retracement level of the recent increase from the $39,269 swing low to $41,548 high. An immediate resistance on the upside is near the $40,200 level. The next key resistance could be $40,400 and the 100 hourly SMA.
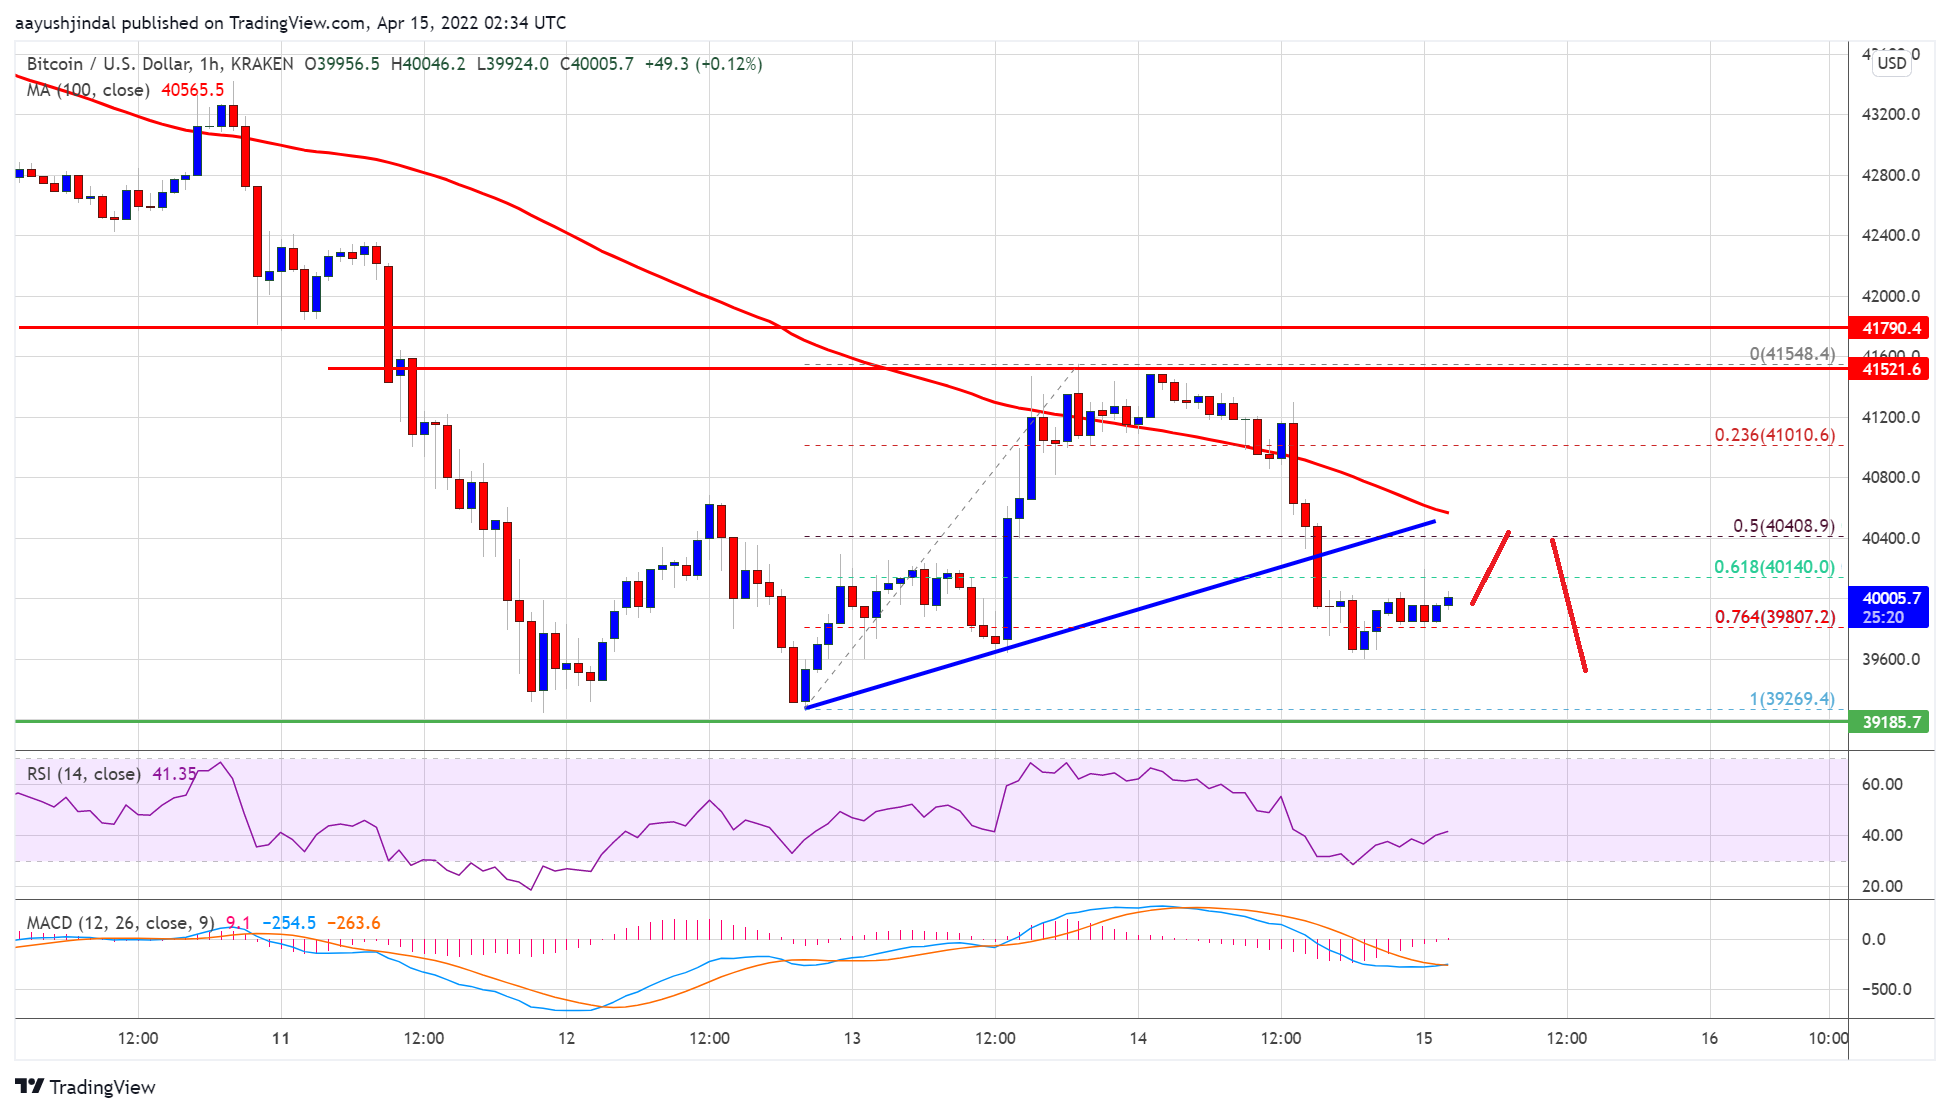
Source: BTCUSD on TradingView.com
If the bulls able to clear the $40,400 and $40,500 resistance levels, the price could start a decent increase. In the stated case, the price may perhaps rise towards the $41,000 resistance zone. Any more gains could set the pace for a move towards the key $41,500 level in the near term.
More Losses in BTC?
If bitcoin fails to clear the $40,400 resistance zone, it could start another decline. An immediate support on the downside is near the $39,650 level.
The next major support is seen near the $39,250 level. A downside break below the $39,250 support zone could accelerate losses. In the stated case, the price could decline towards the $38,500 level or even $37,750.
Technical indicators:
Hourly MACD – The MACD is now gaining pace in the bearish zone.
Hourly RSI (Relative Strength Index) – The RSI for BTC/USD is now below the 50 level.
Major Support Levels – $39,650, followed by $39,250.
Major Resistance Levels – $40,400, $41,000 and $41,500.