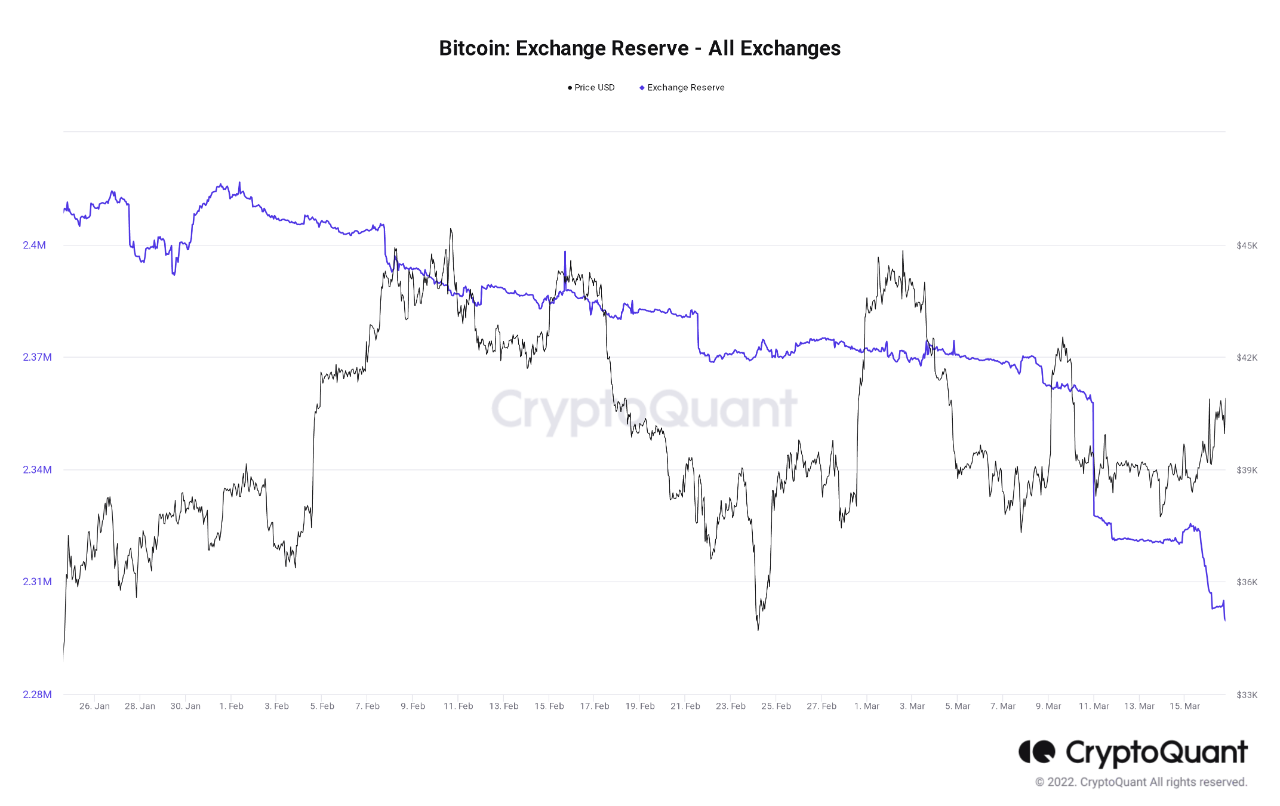
On-chain data shows the Bitcoin exchange reserve has lost another 50k BTC over the past week, a sign that could be bullish for the price of the crypto.
Bitcoin Exchange Reserve Continues To Observe Further Decline In Recent Weeks
As pointed out by an analyst in a CryptoQuant post, 50k BTC in net outflows has exited exchange wallets over the past week.
The “all exchanges reserve” is an indicator that measures the total amount of Bitcoin stored in wallets of all centralized exchanges.
When the value of this metric goes up, it means the supply on exchanges is rising as investors deposit a net amount of coins. Such a trend may be bearish for the price of the coin as holders usually transfer to exchanges for selling purposes.
On the other hand, the reserve’s value decreasing implies that a net amount of Bitcoin is exiting exchange wallets at the moment. This kind of trend when sustained over a period can prove to be bullish for the coin’s price as it may be a sign that investors are accumulating.
Related Reading | Current Stretch Of Bitcoin Fear Surpasses 2021 Selloff
Now, here is a chart that shows the trend in the BTC exchange reserve over the past few months:

Looks like the value of the indicator has sharply gone down recently | Source: CryptoQuant
As you can see in the above graph, the Bitcoin exchange reserve has been going down over the last few months. In the past week alone, the metric has dropped 50k BTC in value. The last couple of days especially saw large downward spikes amounting to around 10k to 11k BTC.
Related Reading | Mike Novogratz: Bitcoin Price To Range Between $30k-$50k Throughout The Year
The exchange reserve has traditionally been considered the “selling supply” of the coin. As it has been shrinking for a while now, the effect on the price should be positive due to supply-demand dynamics.
Some have referred to this decline as creating a “supply shock” in the market. However, recent data suggests that the reserve is no longer the main source of selling pressure, coins exiting from exchanges have instead just shifted into investment vehicles like ETFs.
Nonetheless, the reserve declining does reduce part of the selling supply so the net effect of such a trend may still be bullish.
BTC Price
At the time of writing, Bitcoin’s price floats around $41k, up 5% in the past week. Over the last month, the crypto has lost 6% in value.
The below chart shows the trend in the price of the coin over the past five days.

The price of Bitcoin seems to have seen a surge over the last couple of days | Source: BTCUSD on TradingView
Featured image from Unsplash.com, charts from TradingView.com, CryptoQuant.com
