A quant breaks down how the Bitcoin NUPL indicator may be able to predict the beginning of a new bull run based on past pattern.
How The Bitcoin NUPL Metric May Predict The Start Of Bull Run
As explained by an analyst in a CryptoQuant post, the various phases of the NUPL indicator may shed some light relating to the bull run status for BTC.
The net unrealized profit and loss (or NUPL in short) is a metric that’s defined as the difference between the market cap and the realized cap, divided by the market cap.
NUPL = (Market Cap – Realized Cap) ÷ Market Cap
In simpler terms, what this indicator tells us about is the degree of profit or loss Bitcoin investors as a whole currently observe.
When NUPL values are above zero, it means holders are, on average, in profit. On the other hand, the market as a whole is in a state of profit if the indicator’s value is more than zero.
Related Reading | Comparing Apple’s Growth With Bitcoin, Why This Expert Sets $700K As Long-Term Goal
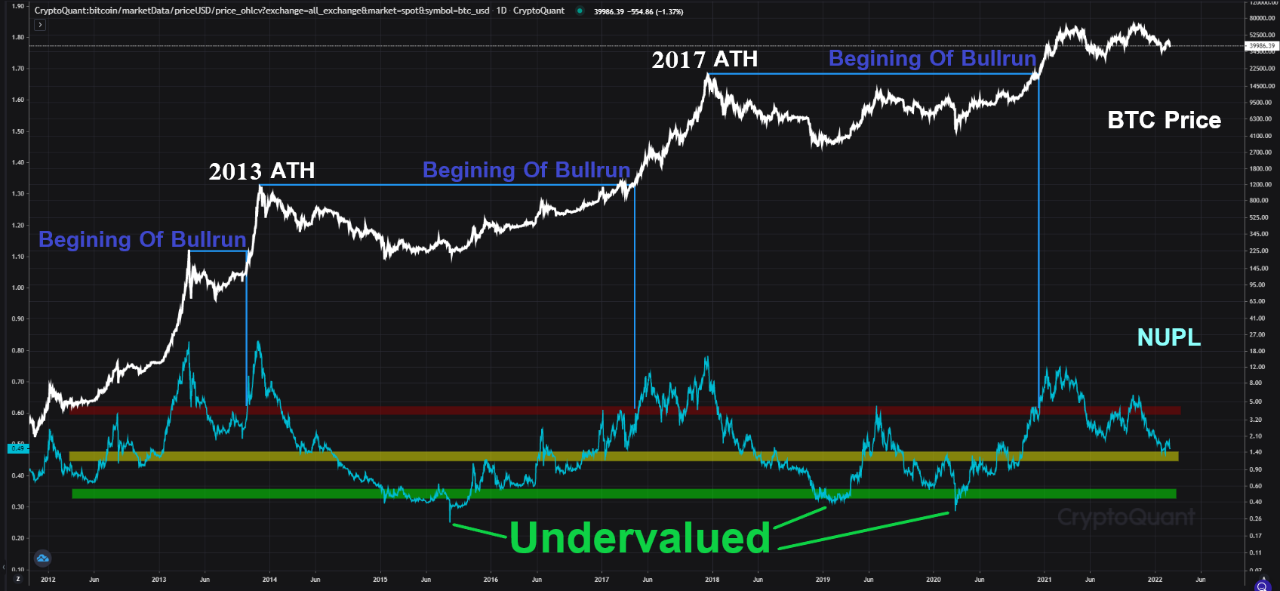
Now, here is a chart that shows the trend in the BTC NUPL over the past ten years:

The correlation between the BTC price and the indicator's values | Source: CryptoQuant
As you can see in the above graph, the quant has marked three different regions of importance for the Bitcoin NUPL metric.
It looks like whenever the metric has crossed above the red line, a BTC bull run has also begun in tandem. The green region, on the other hand, seems to be when the crypto is undervalued, and bottom formations take place.
Related Reading | Pantera Predicts Correlation Between Bitcoin And Traditional Markets Might Break This Spring
According to the analyst, the yellow region is a divider between bull and bear trends. Crossing below this bar has historically marked the beginning of a new bear market.
Currently, the Bitcoin NUPL is right above this region, and if the metric goes down and crosses below it, a new bear period may start. However, the quant has noted that this region can serve as support during the middle of a cycle as well, as it already did once recently.
BTC Price
Today, Bitcoin’s price has plunged down below the $38k mark continuing its recent downfall. At the time of writing, the price of the coin floats around $37.6k, down 10% in the last seven days. Over the past month, the crypto has lost 8% in value.
The below chart shows the trend in the price of BTC over the last five days.

BTC's price seems to have sunk down over the past few days | Source: BTCUSD on TradingView
Featured image from Unsplash.com, charts from TradingView.com, CryptoQuant.com
