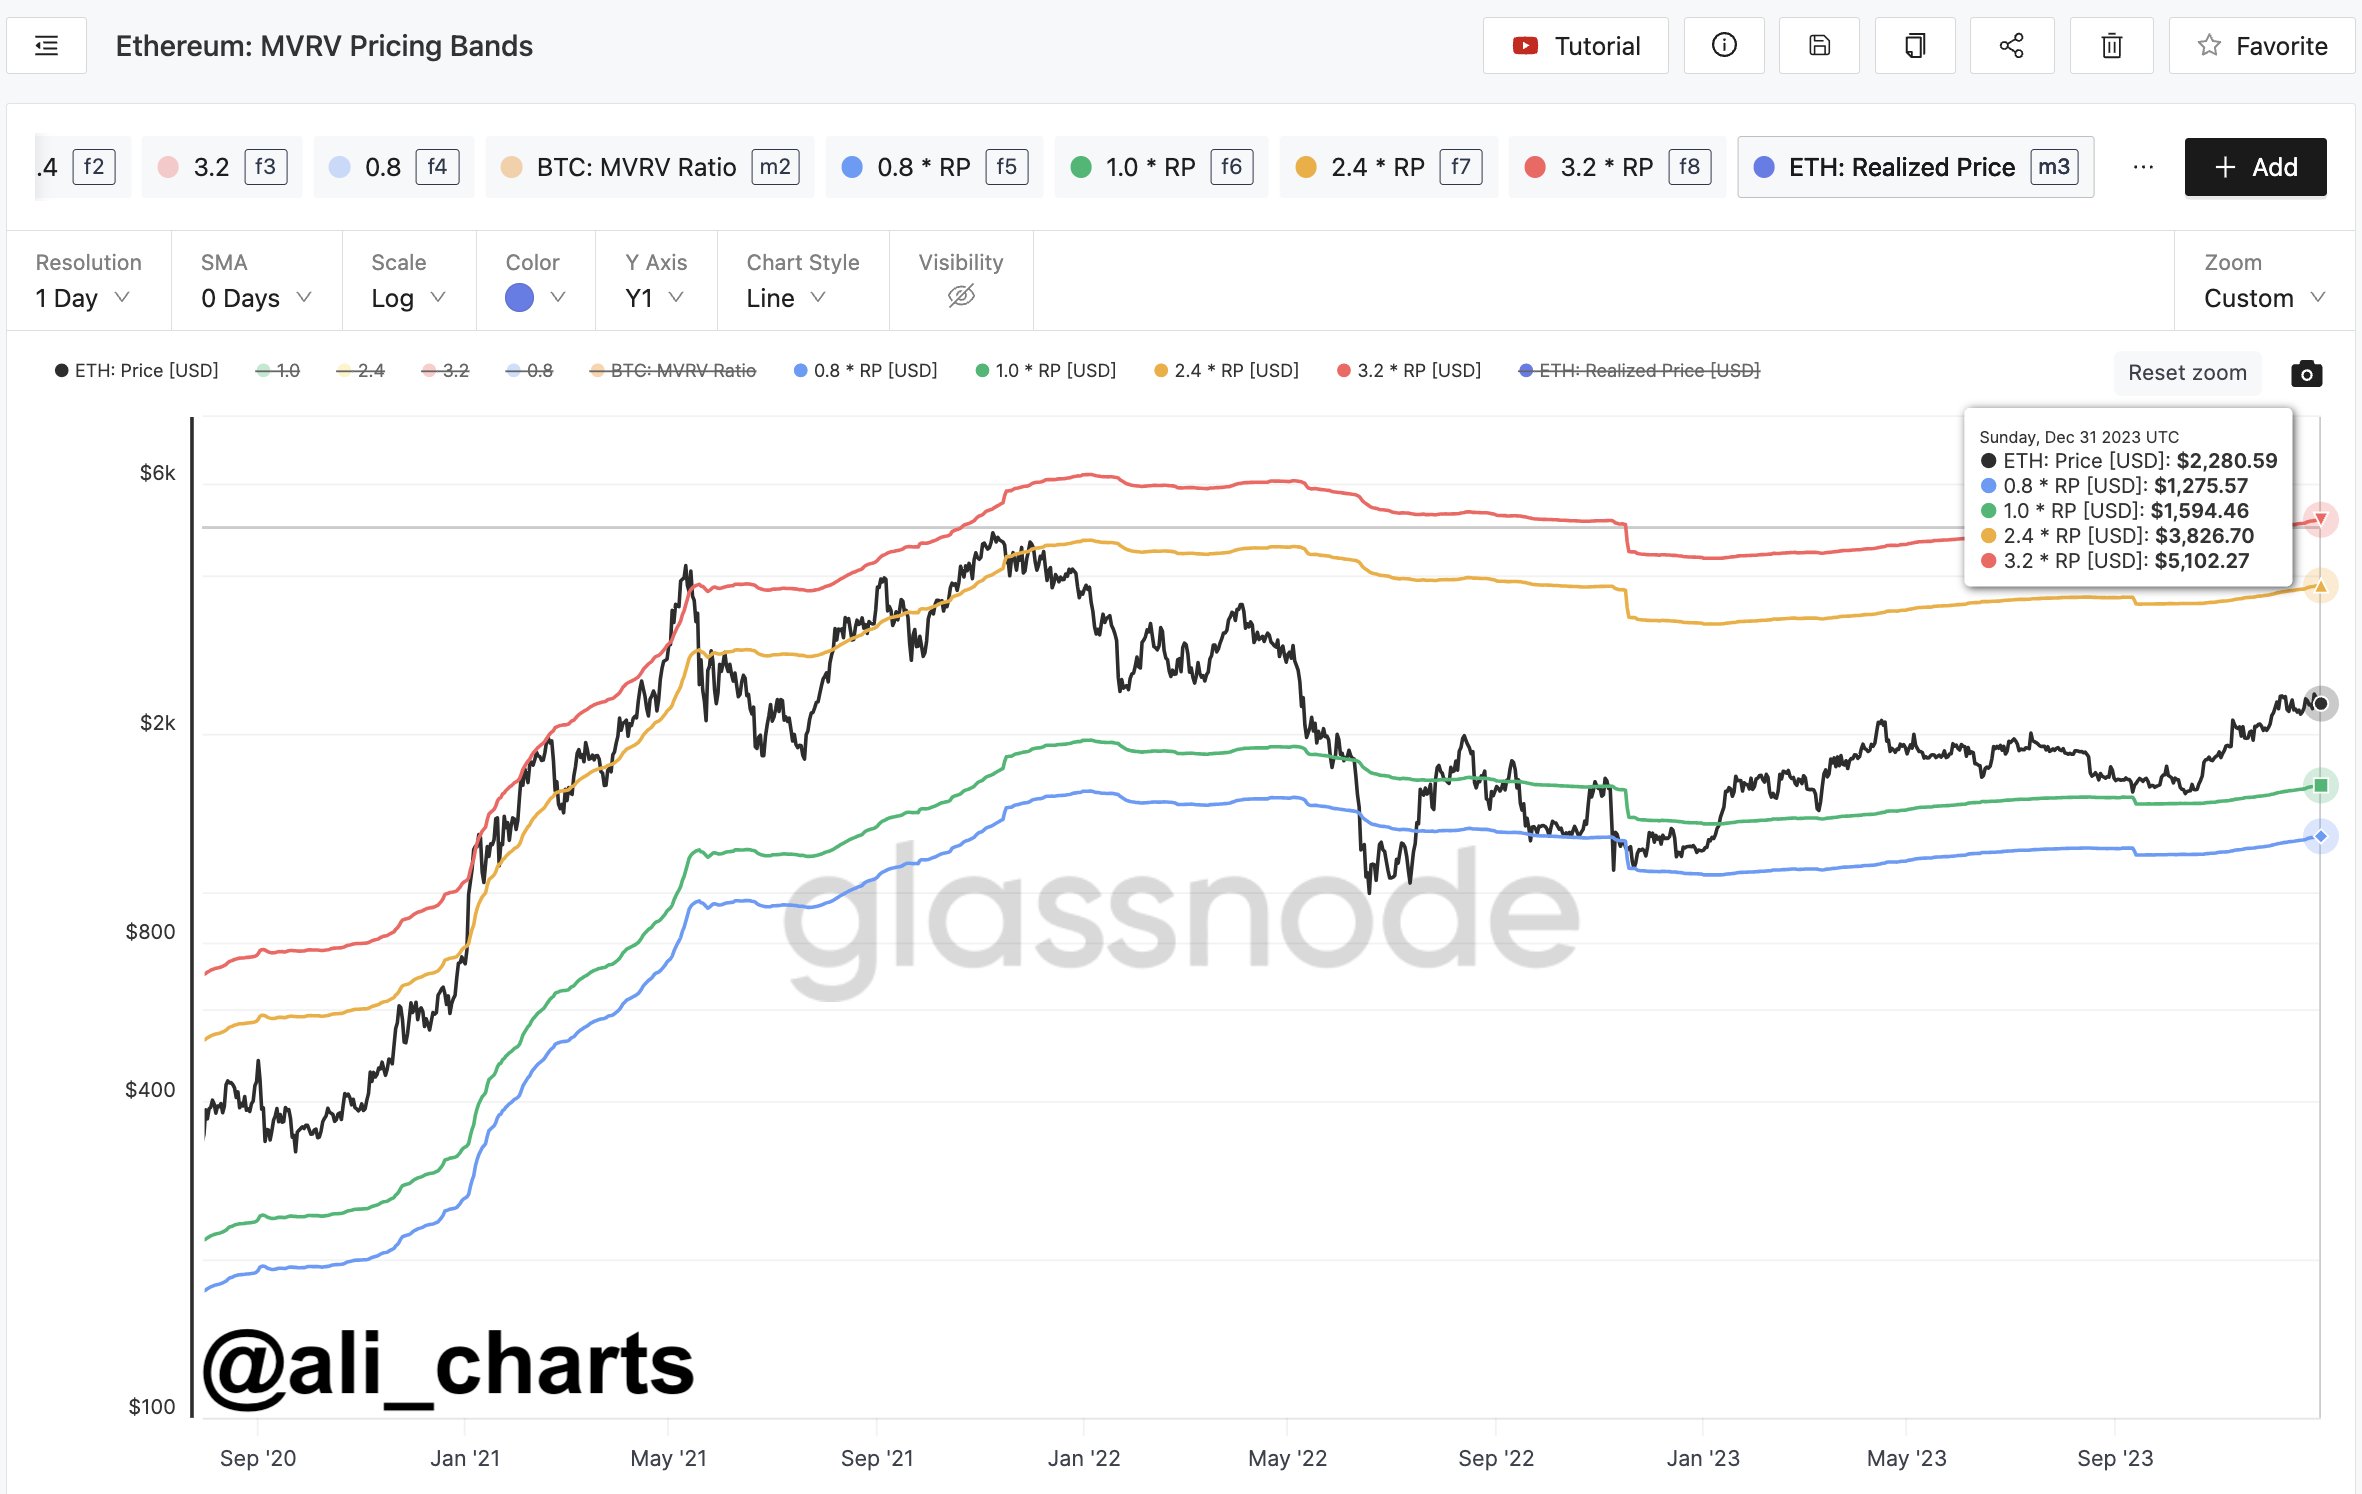
An analyst has explained that $3,830 and $5,100 could be the next major targets for Ethereum based on an on-chain pricing model.
Ethereum MVRV Pricing Bands Have Next Targets At $3,830 And $5,100
In a new post on X, analyst Ali talked about the next key targets for Ethereum based on the “MVRV Pricing Bands.” The “Market Value to Realized Value” (MVRV) is a popular ratio in on-chain analysis calculated by dividing the Bitcoin market cap by its realized cap.
The “realized cap” here refers to a capitalization model for BTC that assumes that the true value of any coin in circulation is not the current spot price but the value at which the coin was last transacted on the blockchain.
The last transfer price of any coin may be considered as its buying price, so the realized cap considers the cost basis of all the investors. Put another way, the indicator keeps track of the total amount the holders have invested in the cryptocurrency.
Thus, the MVRV ratio tells us how the value that the investors hold right now (the market cap) compares against the total investment they made. Because of this, the MVRV ratio is often used to judge whether the asset is overpriced or underpriced currently.
Now, here is a chart that shows “pricing bands” for Ethereum corresponding to different values of the MVRV ratio:
The trend in the MVRV Pricing Bands over the past few years | Source: @ali_charts on X
As displayed in the above graph, Ethereum currently trades above the 0.8 and 1.0 MVRV Pricing Bands. At these lines, the MVRV ratio is 0.8 and 1.0, respectively.
When the price is under these lines, the investors are in a state of loss, and the asset may thus be considered “undervalued.” Historically, this is where bottoms have become more likely to form for the cryptocurrency.
ETH is currently on its way up, with the gap to these lines widening. From the chart, it’s visible that the next important MVRV Pricing Bands are 2.4 and 3.2. At these levels, Ethereum becomes overheated as the investors carry significantly more than they put into the coin.
Profit-taking becomes much more likely when this happens, which can impede any price rise. In the past, the major tops in the cryptocurrency have formed when the price has been above one or both of these levels.
These two MVRV Pricing Bands currently correspond to ETH prices of around $3,830 and $5,100, respectively. Therefore, these ceilings may be ones to watch currently, as the asset hitting the targets could imply that it’s starting to become overvalued.
ETH Price
Ethereum has enjoyed a 4% jump during the past day and has breached the $2,400 level.
Looks like the value of the coin has registered a sharp increase over the last 24 hours | Source: ETHUSD on TradingView
Featured image from DrawKit Illustrations on Unsplash.com, charts from TradingView.com, Glassnode.com
Disclaimer: The article is provided for educational purposes only. It does not represent the opinions of NewsBTC on whether to buy, sell or hold any investments and naturally investing carries risks. You are advised to conduct your own research before making any investment decisions. Use information provided on this website entirely at your own risk.

